Weather Glossary
All the weather terms used in our forecasts, explained in plain language. Terms in blog posts are automatically linked here so you can brush up while reading.
Fundamentals
Baroclinic Zone
Also: baroclinic
A region of strong temperature and moisture contrast between warm tropical air and cold polar air, typically found in the mid-latitudes. This gradient is the engine that drives mid-latitude storm development. In winter, the contrast between the north pole and the tropics is at its strongest, providing maximum energy for storms. The Sierra sits right in the target zone for this conveyor belt of weather.
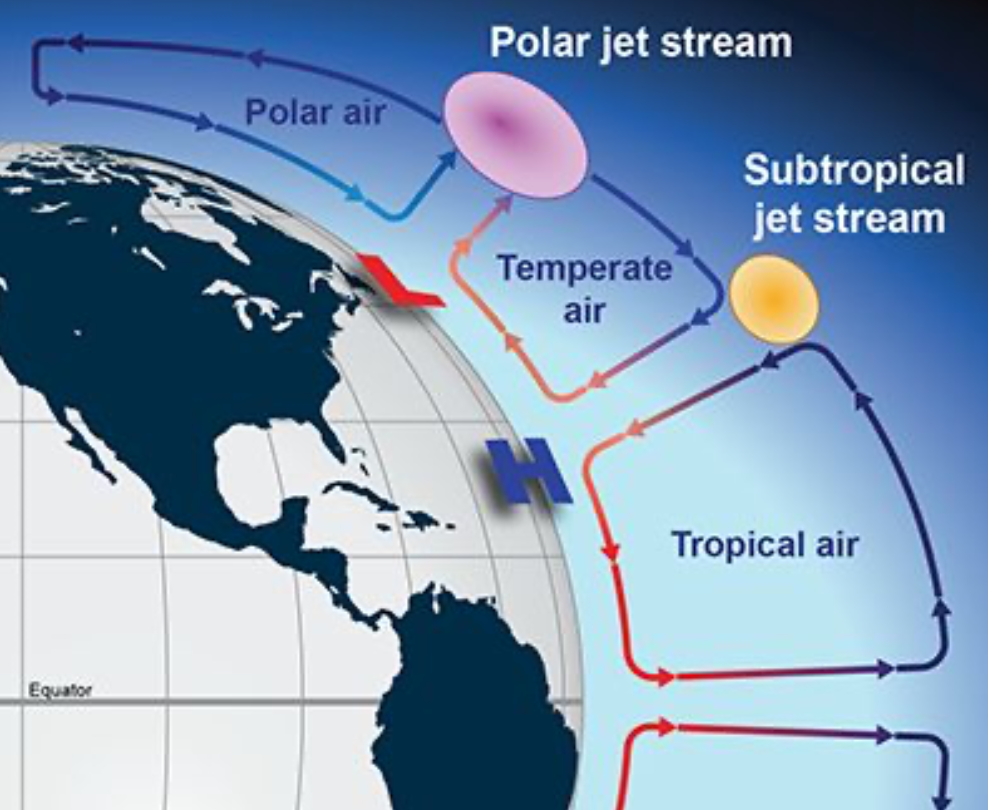
Jet Stream
Also: jetstream, polar jet, subtropical jet
A 100-200 mph river of wind in the upper troposphere (~30,000 ft) that acts as a boundary between air masses. Think of it as a storm highway—it steers storms and generates the energy that creates them. There are two main jet streams: the Polar Jet Stream (which drives most of our winter weather) and the Subtropical Jet Stream (which sits farther south and can enhance moisture transport).
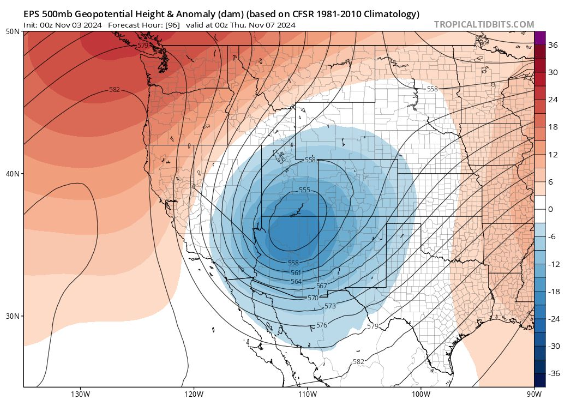
Trough
Also: troughs
A dip or southward plunge in the jet stream. Troughs bring stormy, unsettled, cyclonic weather. The deeper the trough, the more intense the storm potential. On model charts, troughs show up as areas of lower 500mb heights (blue areas). When a trough digs into the West Coast, that's when things get interesting for the Sierra.
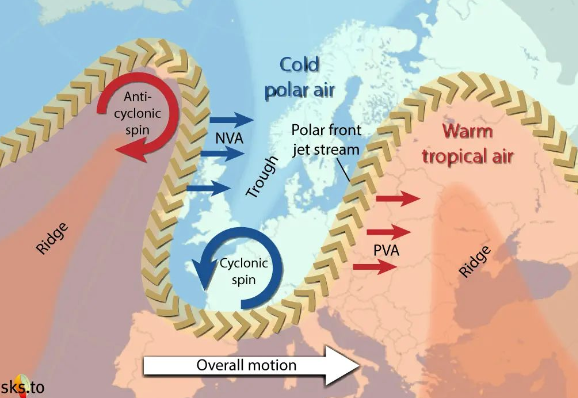
Ridge
Also: ridging, ridges
A peak or northward bulge in the jet stream. Ridges bring dry, warm, and settled weather by deflecting storms away from the area. On model charts, ridges show up as areas of higher 500mb heights (red/orange areas). A persistent ridge off the West Coast is every Sierra skier's worst nightmare—it's the drought maker.
High Pressure System
Also: high pressure, high-pressure
An area of high atmospheric pressure, typically associated with a ridge. Air sinks and warms as it descends, leading to clear skies and dry conditions. In the Northern Hemisphere, highs rotate clockwise (anticyclonically) and act as storm blockers. On model charts, high pressure shows up as positive 500mb height anomalies (red/orange areas).
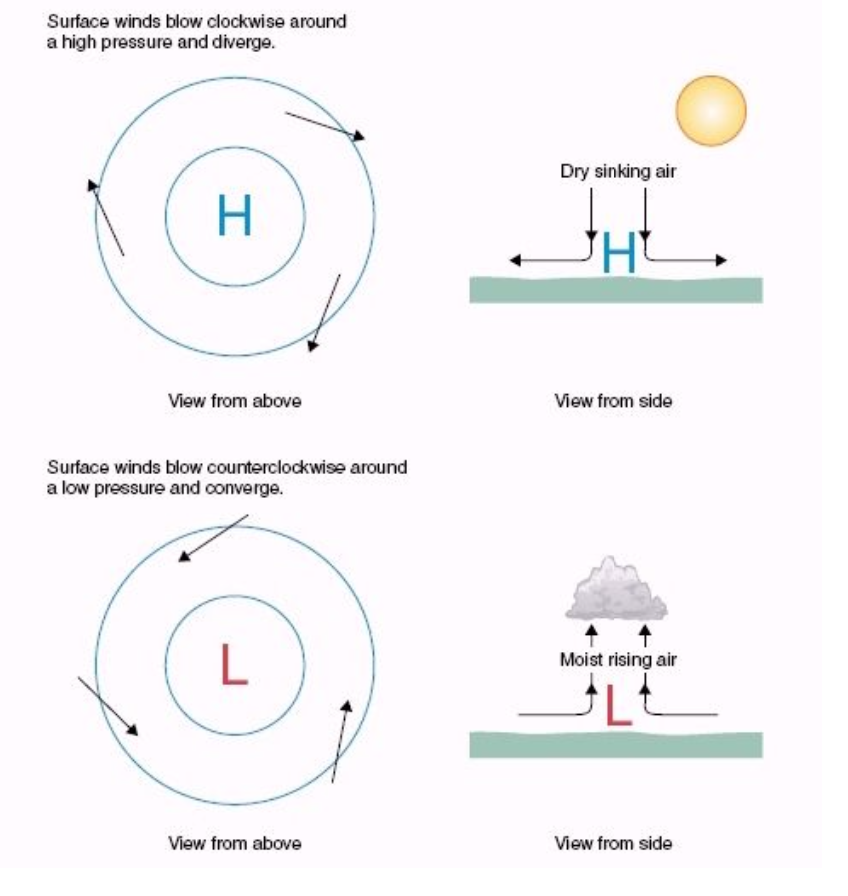
Low Pressure System
Also: low pressure, low-pressure
An area of low atmospheric pressure, either a trough or a closed low. Air converges and rises, cooling as it goes, which leads to clouds and precipitation. In the Northern Hemisphere, lows rotate counter-clockwise (cyclonically). Upper-level divergence from the jet stream pulls air upward, lowering surface pressure and forcing moist air to rise. These systems tap moisture and generate cold fronts, which can cause rain, heavy snow, or atmospheric rivers.
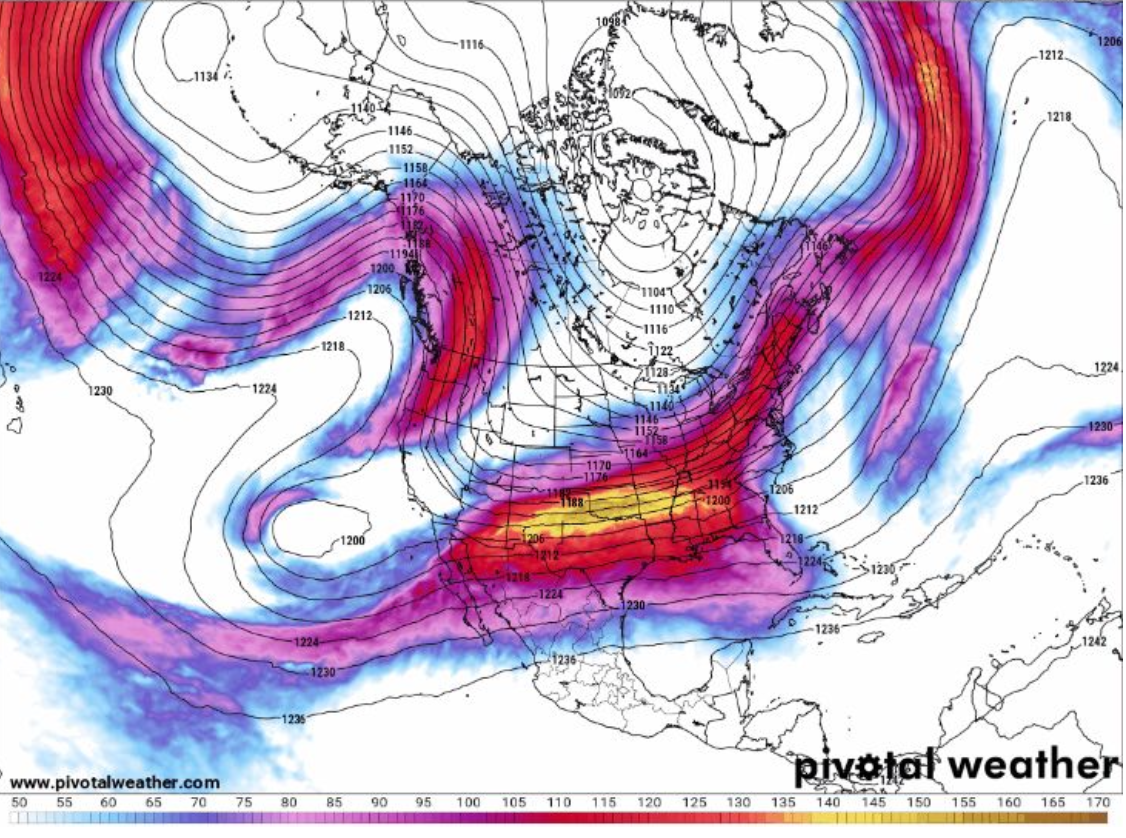
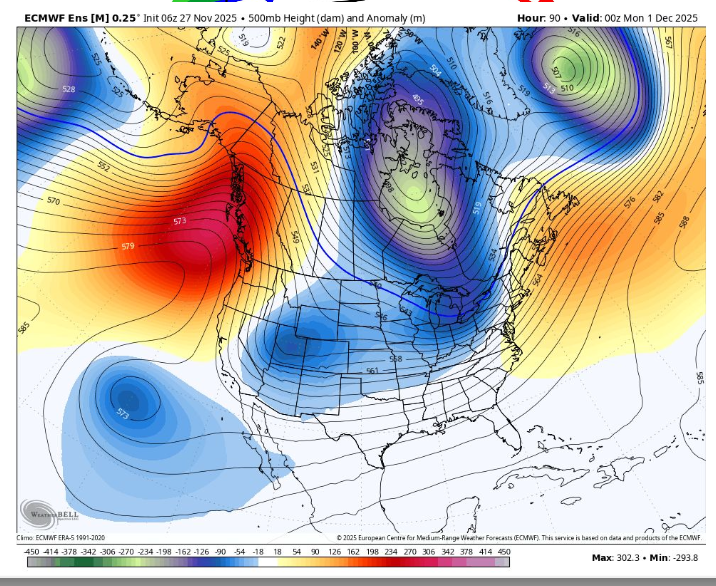
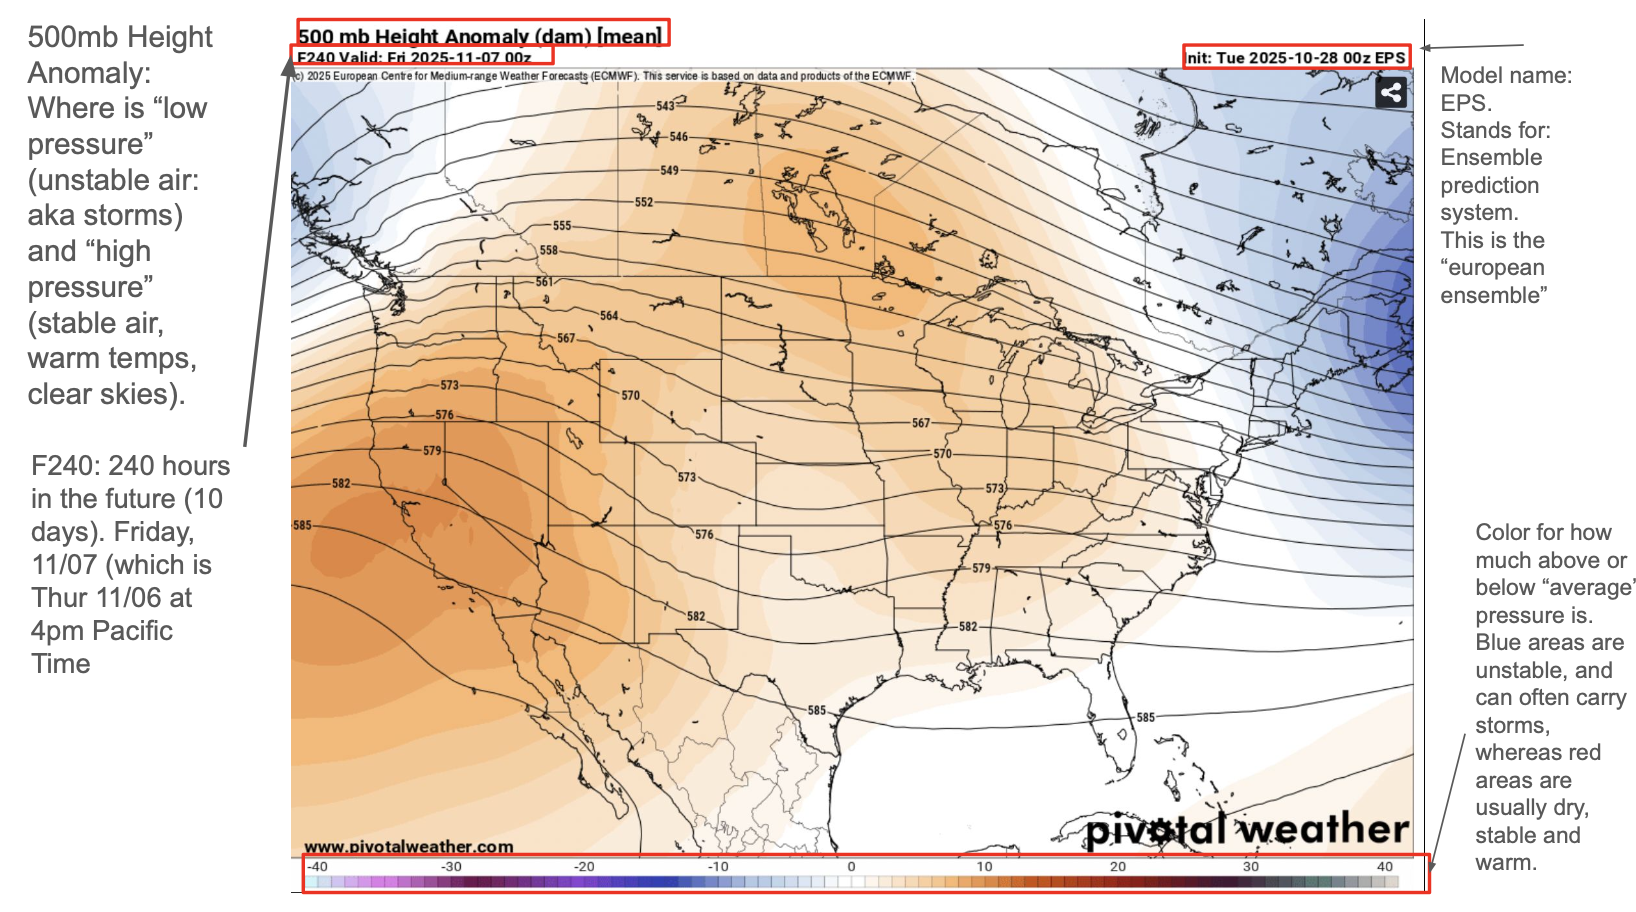
500mb Height Anomaly
Also: 500mb, 500 millibar
The deviation of the height of the 500 millibar pressure surface (~18,000 ft) from its climatological average. This is the single most important chart for storm forecasting. Blue areas indicate lower-than-normal heights (troughs, unstable air, storms), while red areas indicate higher-than-normal heights (ridges, stable air, warm temps, clear skies). One glance tells you where troughs and ridges are, how strong they are, and where storms are likely to develop.
Front
Also: cold front, cold-front, warm front
The boundary between two air masses of different temperature and density. A cold front is where advancing cold air undercuts warmer air, forcing it upward rapidly—this leads to condensation, clouds, and often intense but shorter-lived precipitation. A warm front is where warm air advances over retreating cold air, producing more gradual, widespread precipitation. Most Sierra storms are driven by cold fronts sweeping in from the Pacific.
Storm Types
Pacific Trough
Also: mid-latitude cyclone, mid latitude cyclone
The classic Sierra storm. Caused by a dip (wave) in the Pacific jet stream that spins up a low-pressure system with associated fronts. These are relatively predictable, move with the jet stream flow, and are well-organized. Virtually all winter storms are variations of this mid-latitude cyclone—they just vary in intensity depending on the jet stream strength and moisture available.
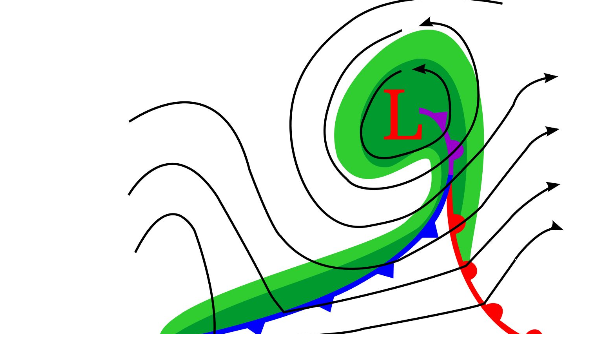
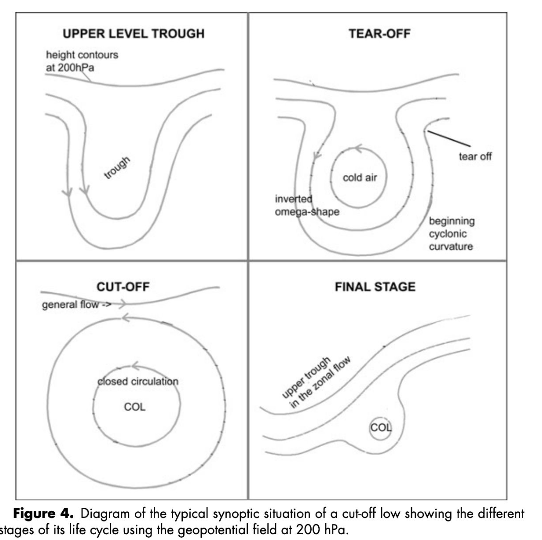
Cutoff Low
Also: cutoff
When the jet stream pinches off and isolates a low-pressure system from the main flow. These are notoriously unpredictable because the system is "cut off" from the jet stream that normally steers storms along. They can stall for days, wobble around erratically, and bring prolonged unsettled weather. Key rule: don't trust any single model run when a cutoff low is involved.
Inside Slider
Also: inside sliders
A low-pressure system that slides down over the land from the north, tracking inland rather than coming off the Pacific. These are typically very cold but often moisture-starved since they don't tap the ocean. If they track far enough west to pick up Pacific moisture, they can be absolute powder machines. A classic boom-or-bust setup—a slight deviation east or west makes or breaks the storm.
Oscillations & Teleconnections
North Atlantic Oscillation (NAO)
Also: NAO, North Atlantic Oscillation
Based on the surface sea-level pressure difference between the Subtropical (Azores) High and the Subpolar Low in the North Atlantic. A positive NAO means below-normal pressure across the high latitudes of the North Atlantic and above-normal pressure over the central North Atlantic, eastern US, and western Europe. The negative phase is the opposite. A positive NAO typically means SoCal stays drier.
El Niño–Southern Oscillation (ENSO)
Also: ENSO, El Nino, El Niño, La Nina, La Niña
A recurring climate pattern involving changes in the temperature of waters in the central and eastern tropical Pacific Ocean. On cycles of roughly three to seven years, the surface waters warm (El Niño) or cool (La Niña) by 1–3°C compared to normal. ENSO has complicated effects on the Sierra—it's not as simple as "El Niño = wet" like people think. The effects depend heavily on how ENSO interacts with the PNA, EPO, and MJO.
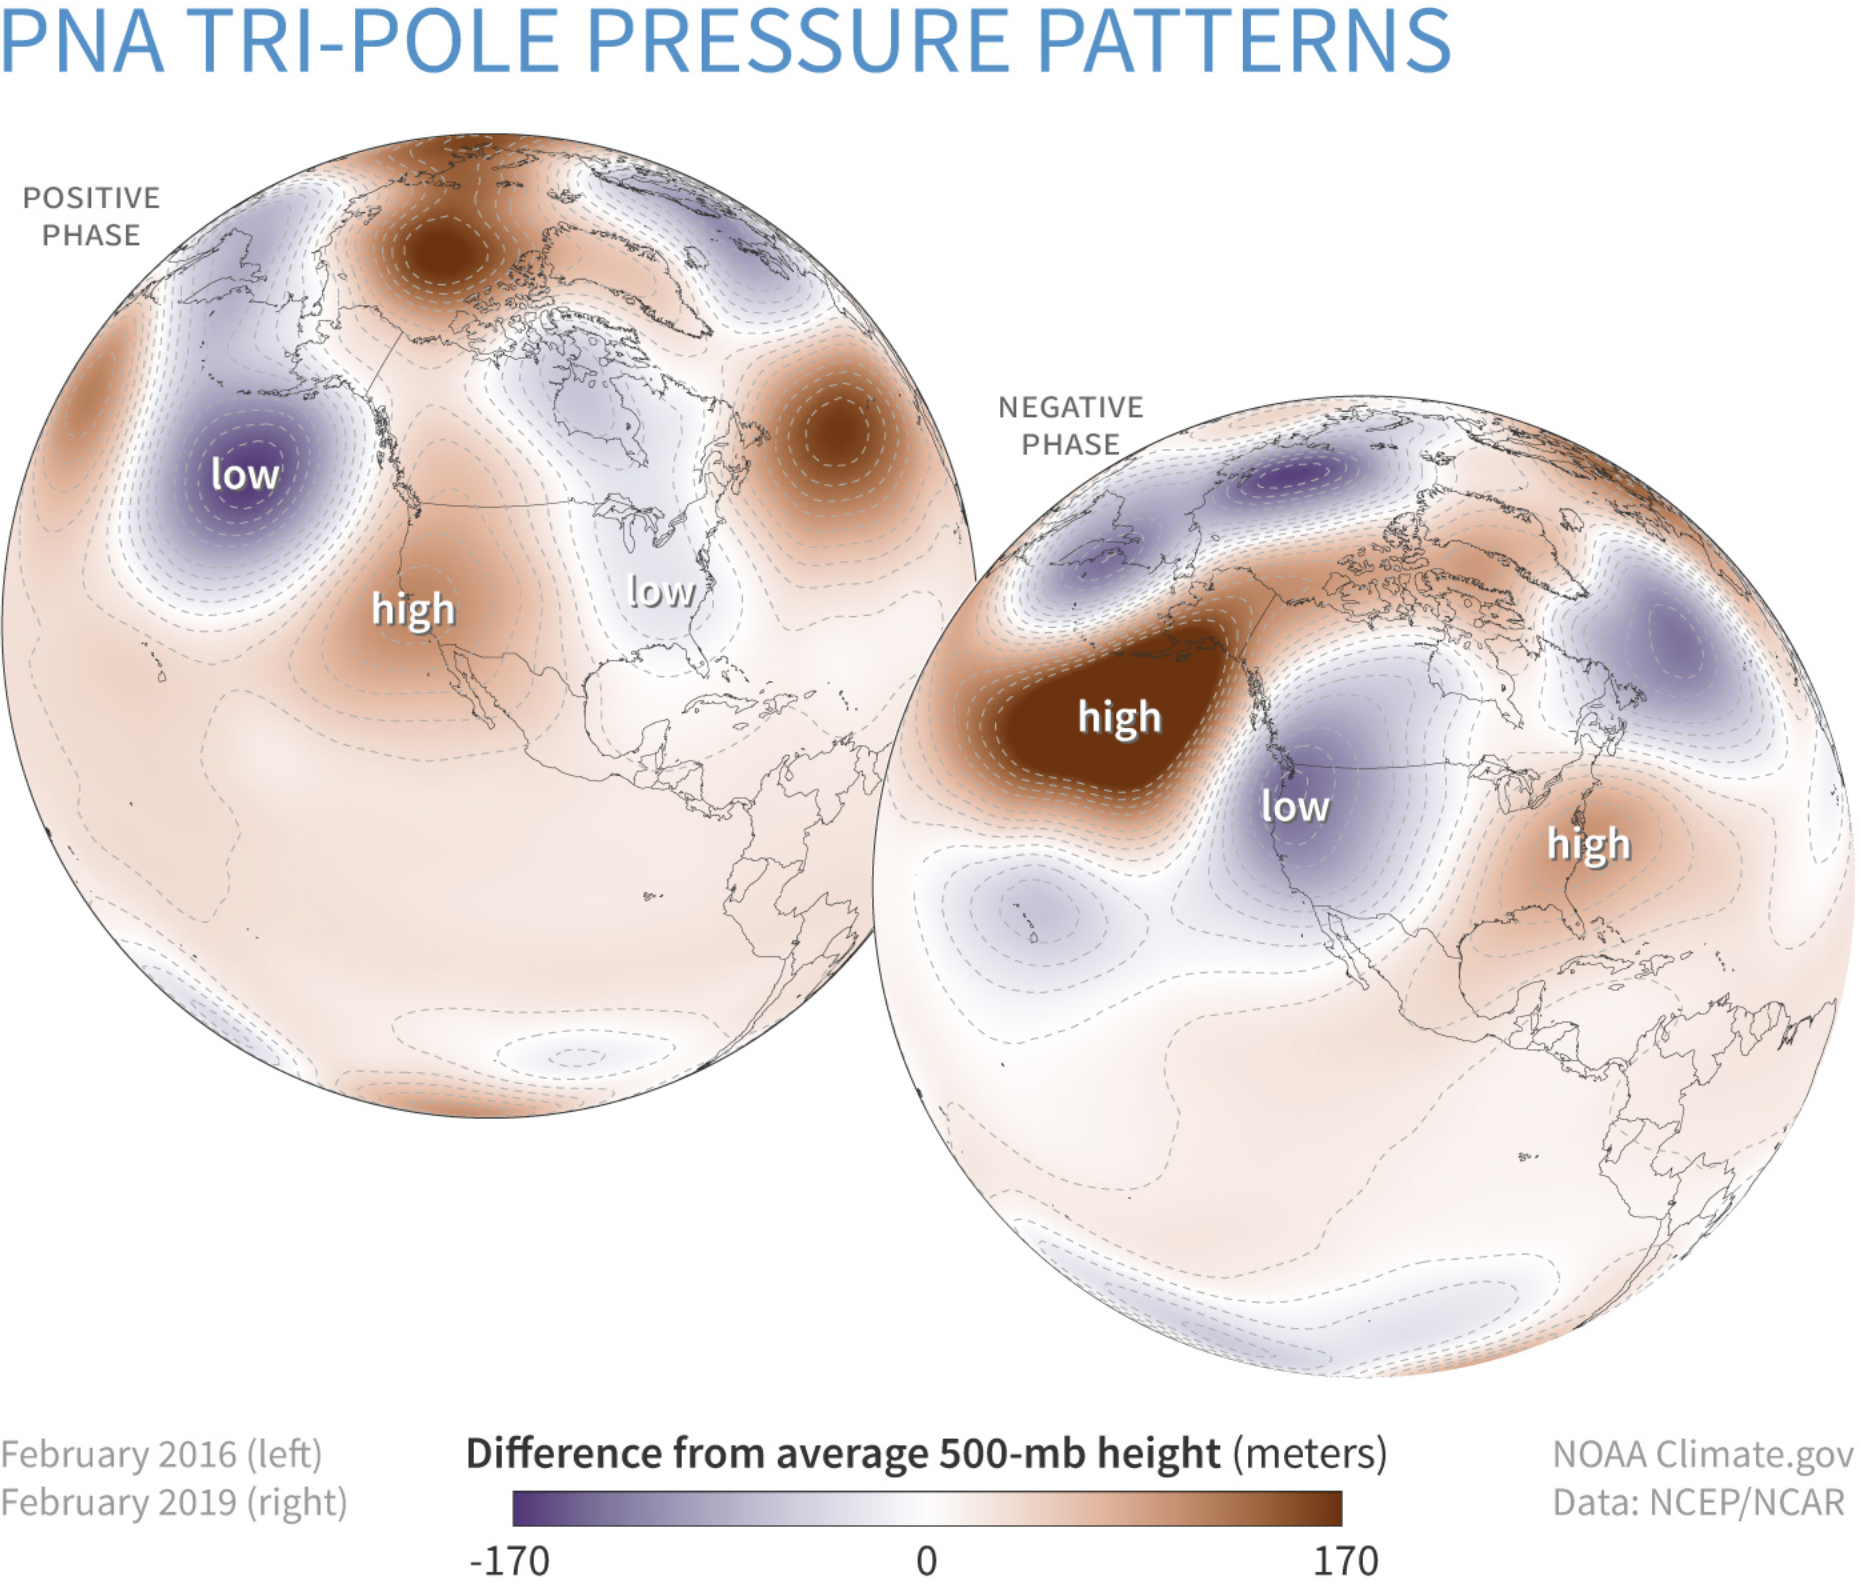
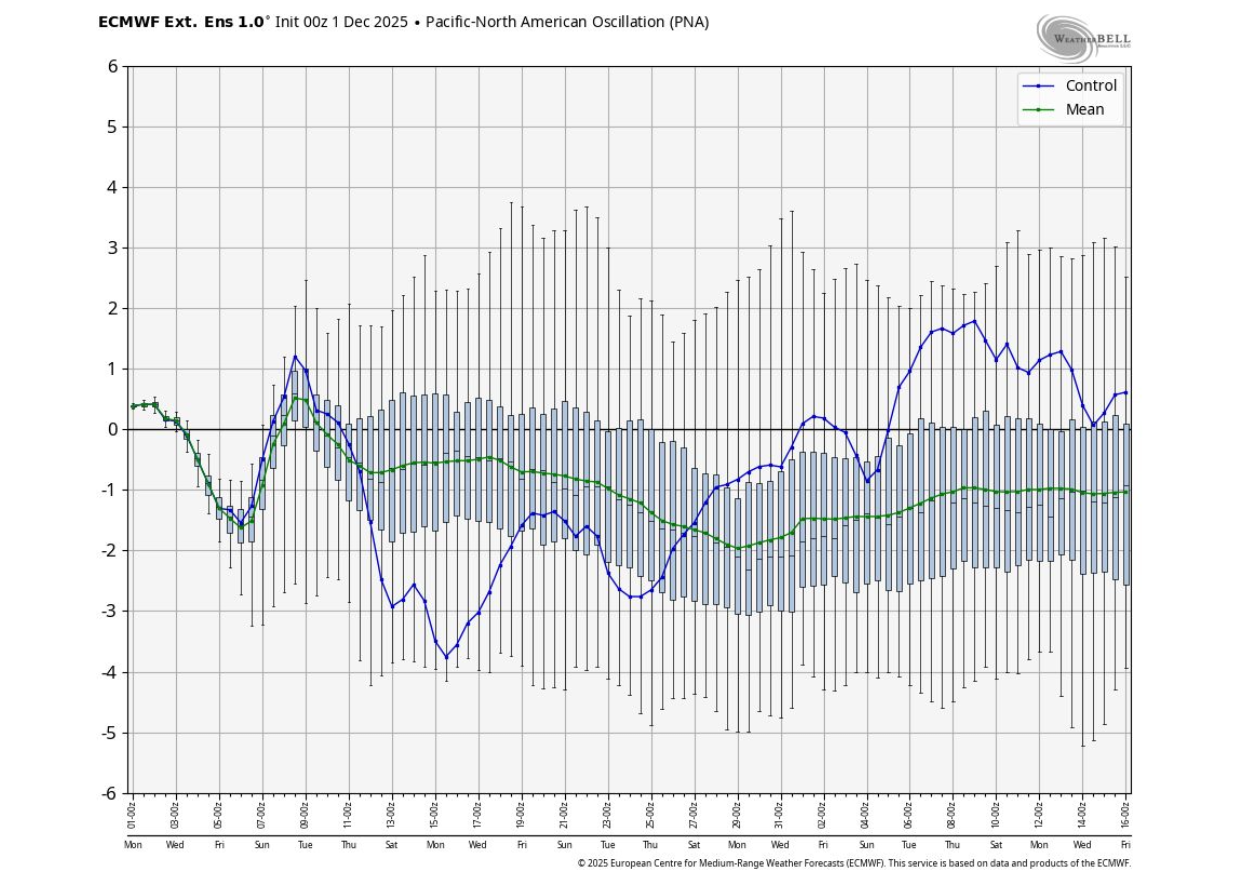
Pacific-North American Pattern (PNA)
Also: PNA, Pacific-North American
A large-scale jet stream pattern over the west coast with two modes: positive and negative. A negative PNA means the storm door is open—troughing over the west coast and storms are more likely for the Sierra. A positive PNA indicates ridging over the west coast and dry conditions. This oscillation can be stubborn and slow-moving, so when it locks in, it tends to stay that way for a while.
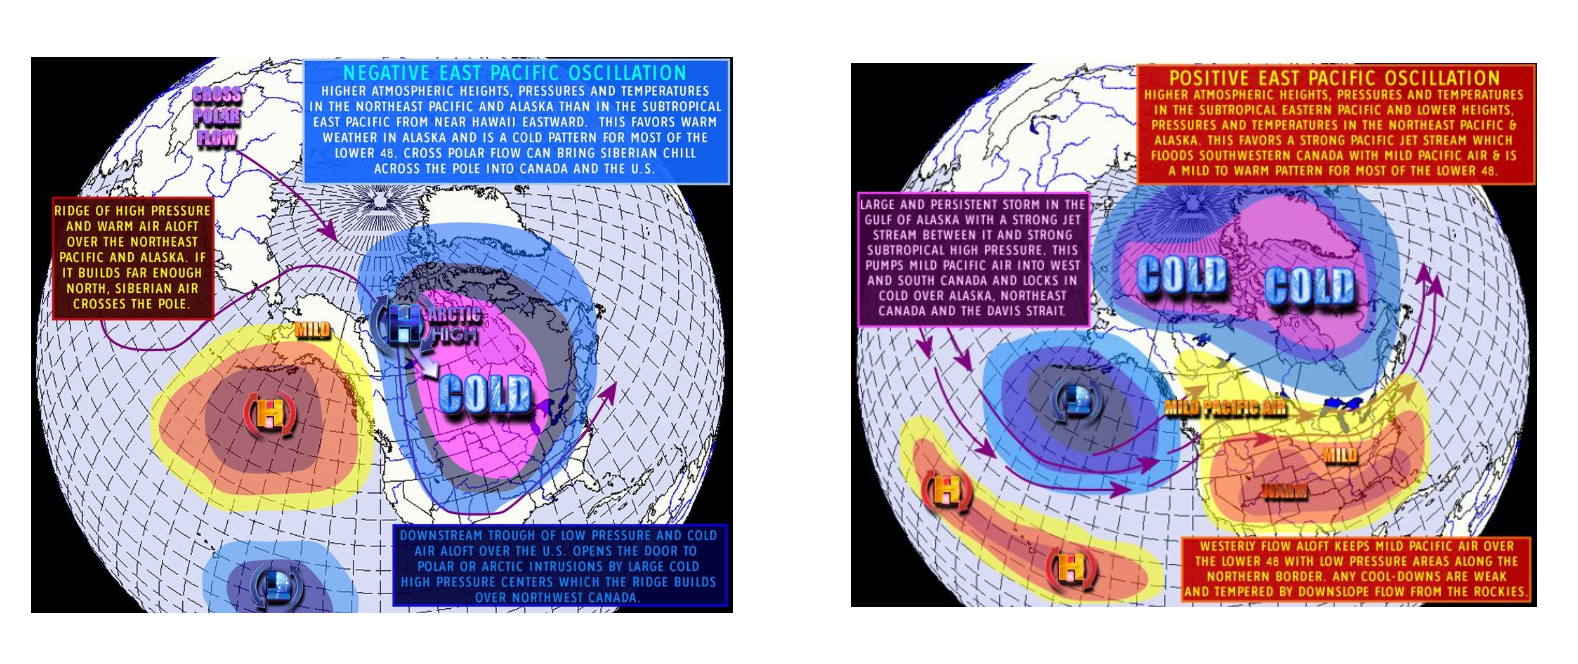
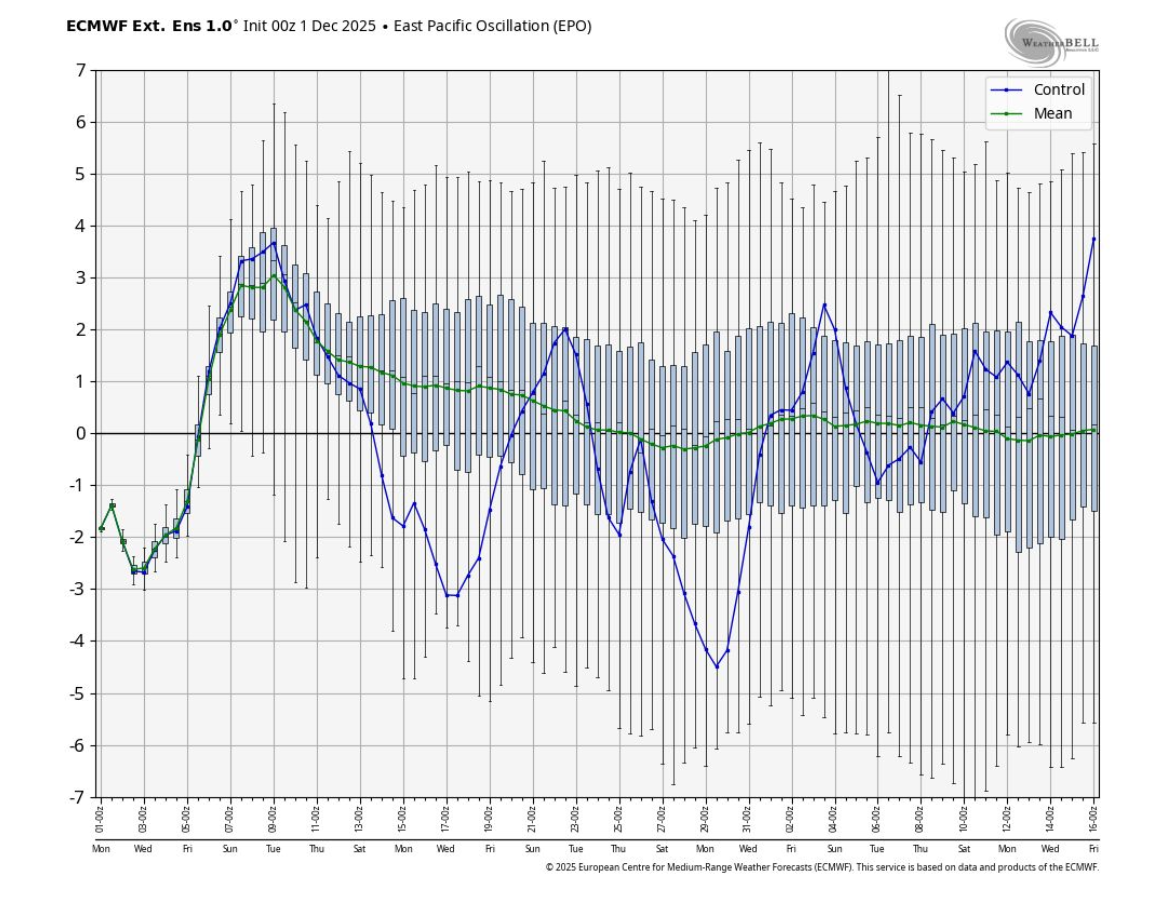
Eastern Pacific Oscillation (EPO)
Also: EPO, Eastern Pacific Oscillation
Describes the ridge/trough pattern over the Gulf of Alaska. A positive EPO means a trough over the Gulf of Alaska, allowing storms to flow more readily into California. A negative EPO means a ridge blocks that path—the jet stream retreats and storms get deflected. When the EPO goes negative, it's often bad news for Sierra snow chasers.
Quasi-Biennial Oscillation (QBO)
Also: QBO, Quasi-Biennial Oscillation
A quasi-periodic oscillation of the equatorial zonal wind between easterlies and westerlies in the tropical stratosphere, with a mean period of about 28 months. One of the more complex teleconnections—it can influence the behavior of the jet stream, the frequency of sudden stratospheric warming events, and storm patterns on seasonal timescales.
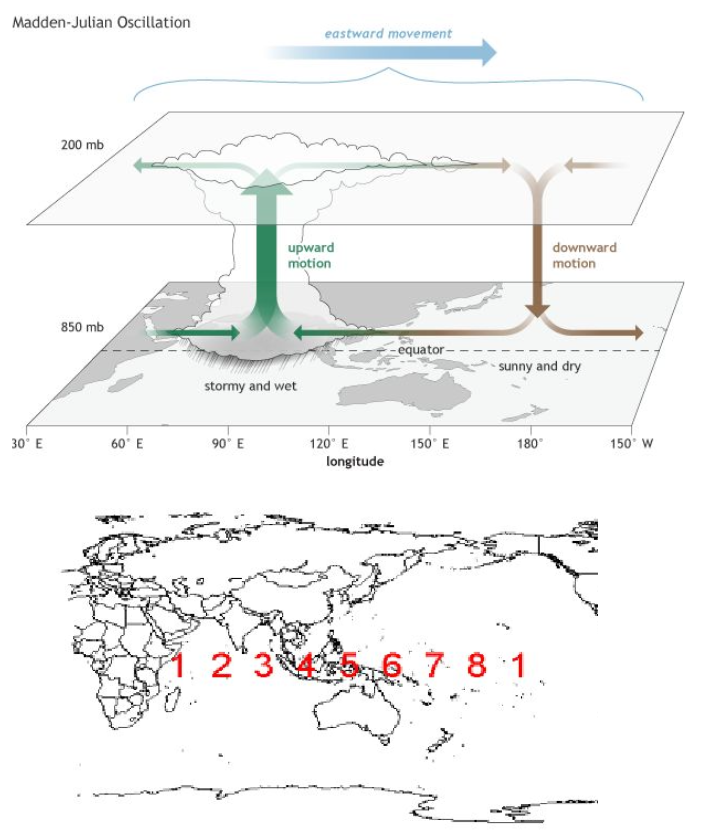
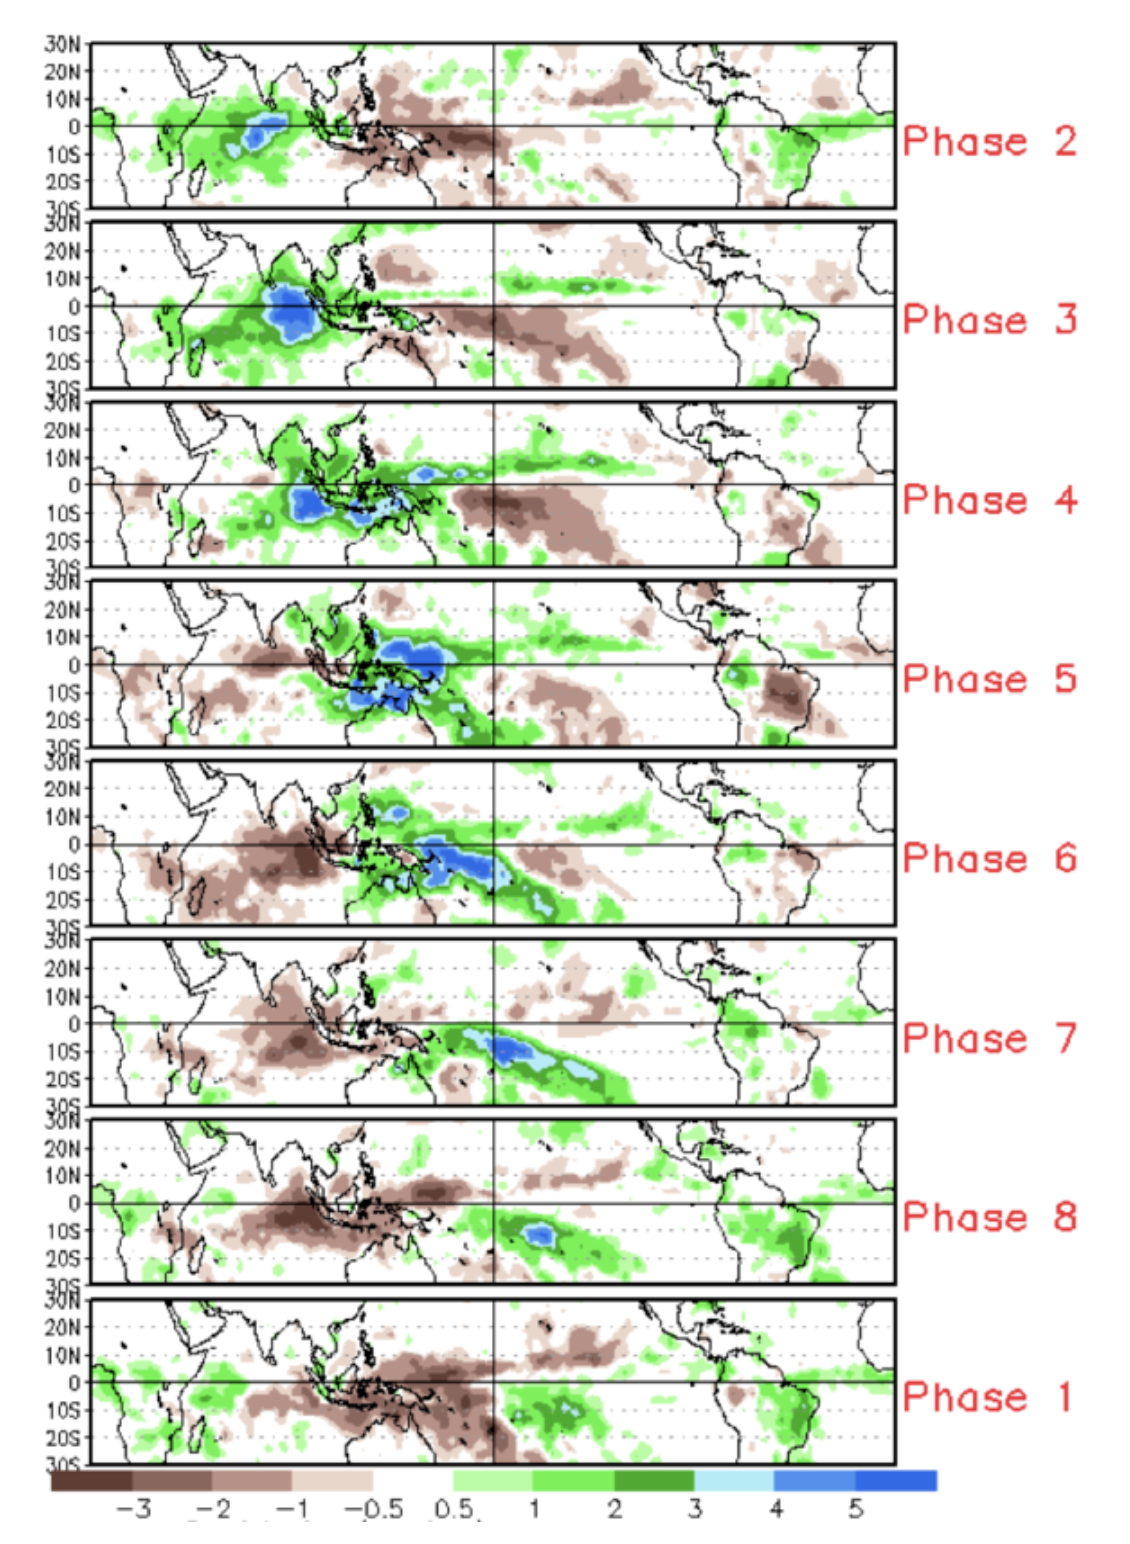
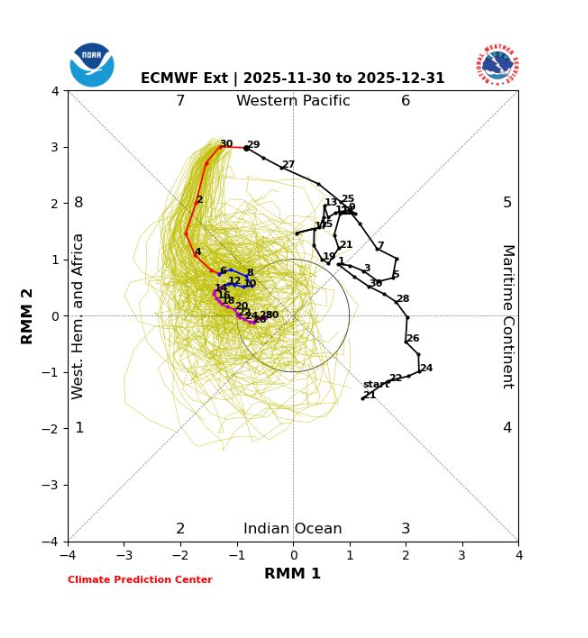
Madden-Julian Oscillation (MJO)
Also: MJO, Madden Julian Oscillation, Madden-Julian Oscillation
An eastward-moving disturbance of clouds, rainfall, winds, and pressure that traverses the tropics, returning to its starting point in 30 to 60 days on average. This is the most important sub-seasonal connection for Sierra storms—most of the "forcing" energy comes from the tropics. Phases 6, 7, 8, and 1 tend to favor more moisture for our region, with downstream effects on the mid-latitudes that take 5–20 days to show up. It's tracked on an RMM chart where the black line shows the last 30 days and the red line predicts the next 10. MJO phases don't guarantee anything, but they tilt the odds. After reaching phase 1, the signal typically sputters out and respawns in a previous phase.
Models
Weather Model
Also: model run, model runs
A physical simulation of the atmosphere. It starts with temperature, moisture, and other data at all levels, alongside the earth's topography, soil moisture, and more. From those "initial conditions," it uses the laws of physics to simulate how the atmosphere evolves over time. A model is just a model—one run should never be trusted as the truth. A single model run is a possible outcome, not necessarily what will happen. Always check multiple models and look at trends.
Operational Model
Also: deterministic model, deterministic models, operational models
A single high-resolution simulation that starts with the best-available initial conditions and tries to predict the atmosphere's evolution. They run out to 10–16 days at 3–6 hour time steps. Useful within about 5 days, but beyond that, treat them as a low-probability glimpse at what might happen rather than a real forecast.
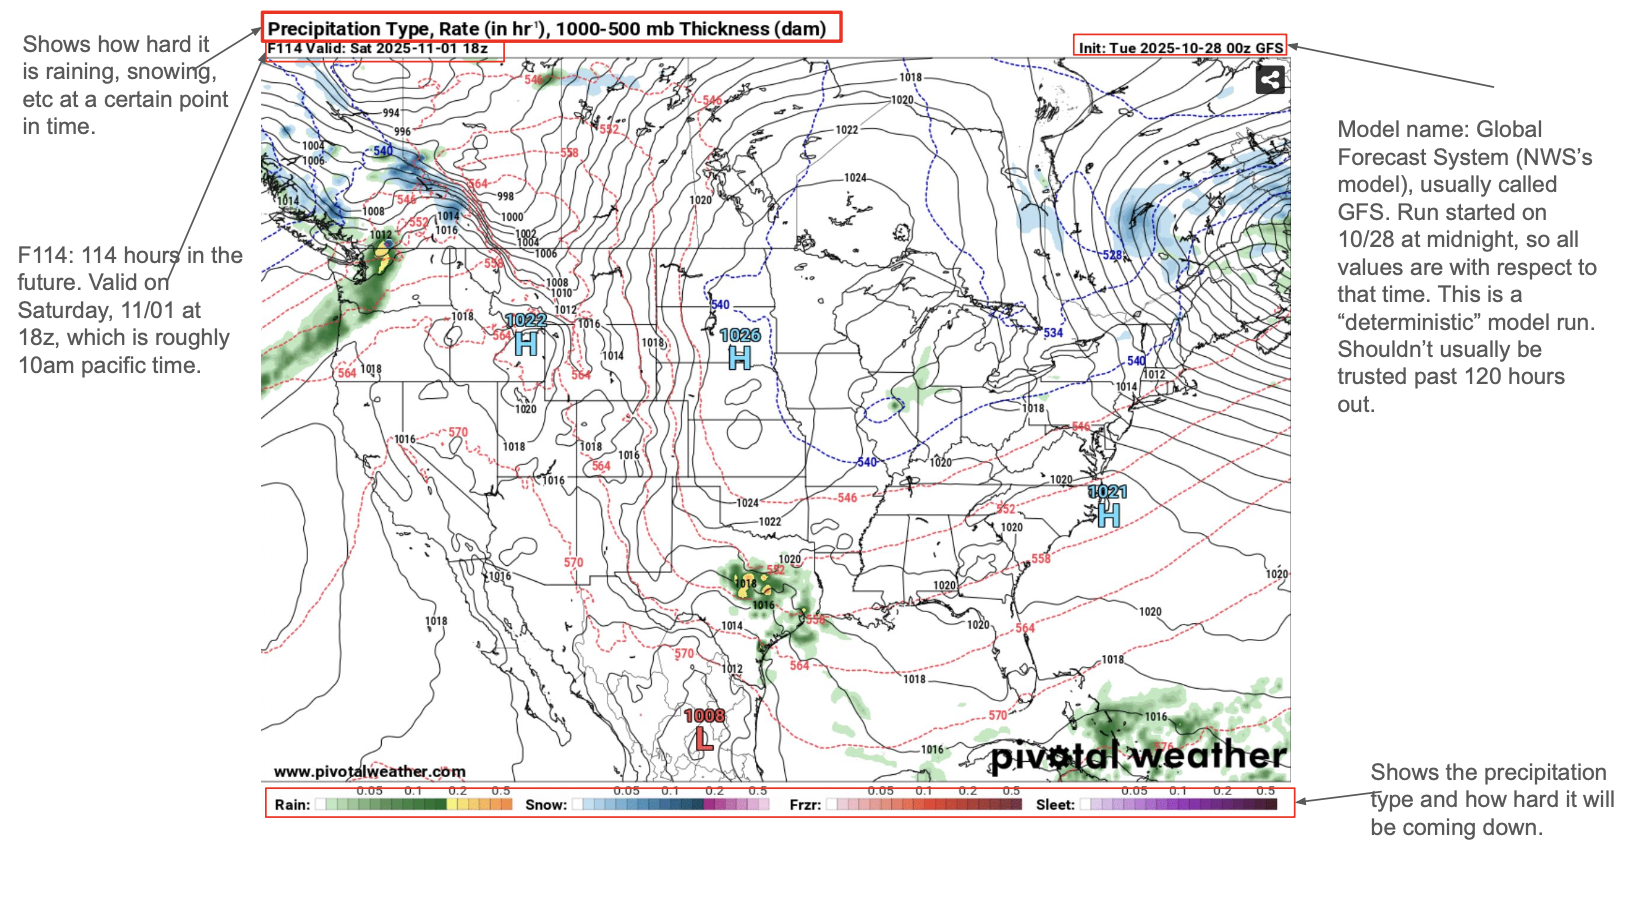
Global Forecast System (GFS)
Also: GFS, Global Forecast System
Run by NOAA (United States). Historically considered volatile and often inaccurate, but it has improved significantly in recent years. Still tends to be jumpier between runs compared to the ECMWF—it'll show a big storm one run and then completely remove it the next.
European Centre for Medium-Range Weather Forecasts (ECMWF)
Also: ECMWF, Euro, European model, the euro
Widely considered one of the best global models and ensemble systems in the world. Their long-range weekly models extend out to 46 days. The ECMWF tends to be more realistic and consistent between runs compared to the GFS. Often referred to simply as "the Euro."
GDPS (Canadian Model)
Also: GDPS, Canadian model
The Global Deterministic Prediction System, run by Environment and Climate Change Canada. A solid operational model that offers another independent perspective alongside the GFS and ECMWF.
ICON (German Model)
Also: ICON
The Icosahedral Nonhydrostatic model, run by the German Weather Service (DWD). A solid model that provides yet another independent take on the atmosphere.
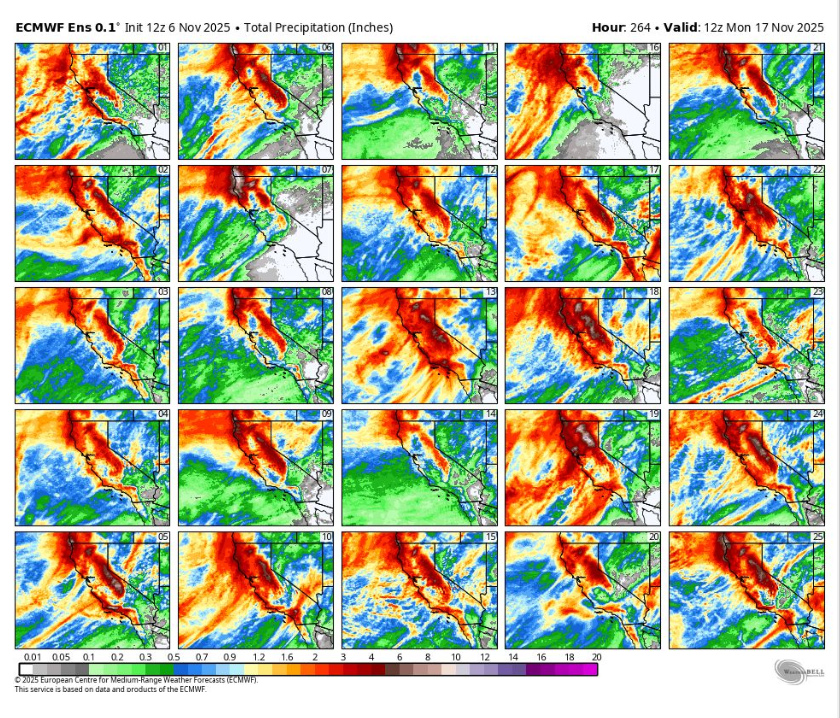
Ensemble Model
Also: ensemble, ensembles, EPS, GEFS, ensemble models
A collection of many runs (20–50 "members") with slightly different initial conditions, designed to capture the uncertainty in the atmosphere. When a signal emerges from an ensemble—meaning most members agree—it's much more reliable than any single model run. Beyond 5 days, ensembles are really the only game in town. Examples include the ECMWF EPS, Canadian Ensemble, and GEFS.
Hi-Res Model
Also: hi-res, high resolution model, RRFS
Models with fine spatial resolution (often 3 km or less) and short time steps. Better at 0–48 hours because they resolve terrain like mountains properly and capture smaller-scale dynamics like thunderstorm cells and precipitation bands. Updated frequently—some run every hour. Examples include the HRRR and RRFS.
HRRR
Also: High Resolution Rapid Refresh
High Resolution Rapid Refresh—a 3-km resolution model that updates every hour with 18-hour forecasts, and extends to 48 hours four times a day. The go-to model for short-range detail: precipitation bands, snow levels, thunderstorm cells, and timing. If a storm is within two days, this is where you look.

AI Weather Models
Also: AI model, AI models
A new generation of weather models that use machine learning instead of traditional physics simulations. Trained on decades of historical reanalysis data, they can produce surprisingly accurate forecasts at a fraction of the computational cost. Models like Google's GenCast and GraphCast, Huawei's Pangu-Weather, and ECMWF's AIFS are increasingly being used alongside conventional models and showing real skill, especially in the medium range.
WPC Blend
Also: WPC Blend, National Blend
The National Blend of Models (NBM), produced by the Weather Prediction Center. A statistically post-processed blend that weights multiple models based on their historical strengths and weaknesses. Often shown to be more accurate than any individual model alone because it smooths out individual model biases.
Weather Phenomena
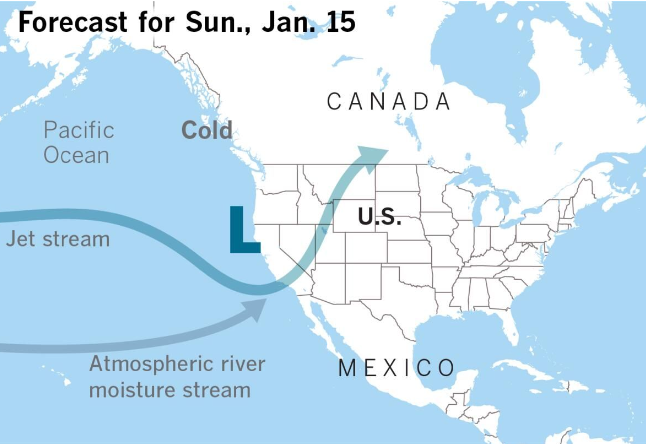
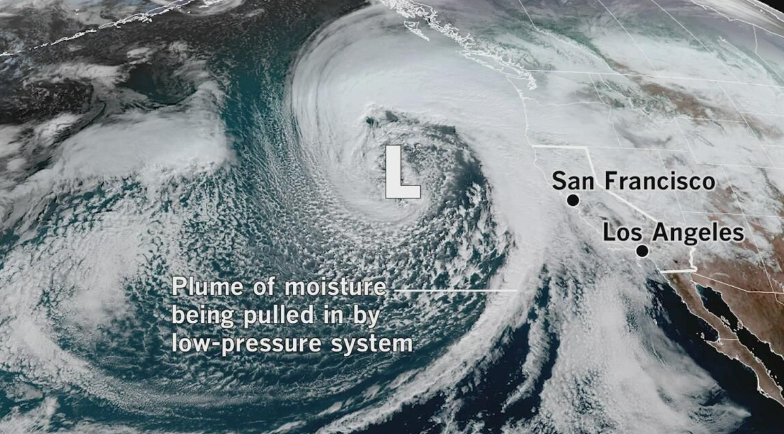
Atmospheric River
Also: atmospheric rivers, Pineapple Express
A narrow plume of concentrated moisture transport moving through the lower atmosphere, drawing water vapor from the tropics to the mid-latitudes. Responsible for roughly 30–50% of California's annual precipitation. Formerly and sometimes still called the "Pineapple Express" when the moisture source is near Hawaii. Warm ARs result in high snow levels and rain at ski-area elevations, while cold ARs bring huge dumps of snow. The key is where the cold air is. AR + mountains = orographic lift = big totals.
Bomb Cyclone
Also: bombogenesis, bomb cyclones
Bombogenesis is when a storm undergoes explosive intensification—specifically, when its central pressure drops by at least 24 millibars in 24 hours (adjusted for latitude). These are intense storms that can bring extreme winds and heavy precipitation. When one of these targets the Sierra, it's usually a memorable event.
Narrow Cold Frontal Rainband (NCFR)
Also: NCFR, narrow cold frontal rainband
A tight, intense band of precipitation that forms along particularly sharp cold frontal boundaries. Easily visible on radar and satellite as a narrow line of heavy precip. NCFRs are typically accompanied by strong gusty winds and brief but intense rainfall or snowfall. When one sweeps through, you'll know it—conditions can go from calm to wild in minutes.
Aleutian Ridge
Also: Aleutian ridge
A high-pressure ridge over the Aleutian Islands in the North Pacific. This pattern redirects storms southward toward California instead of letting them track into Alaska. Ridging over the Aleutians is often good news for Sierra snowfall—it's essentially a roadblock that forces the storm track in our direction.
Hudson Low
Also: Hudson low
A low-pressure system centered over Hudson Bay in Canada. This pattern often amplifies the jet stream into a more meridional (wavy) configuration, and can mean that SoCal stays drier while the northern tier of the US gets active. The position and depth of this low influences the overall jet stream pattern across North America.
Meridional Flow
Also: meridional
An atmospheric flow pattern with a strong north-to-south (or south-to-north) component, following the Earth's longitude lines. This means the jet stream is making big, wavy dips and peaks rather than flowing straight west-to-east. Meridional flow leads to more extreme weather—deeper troughs, stronger ridges, and bigger temperature swings.
Zonal Flow
Also: zonal
An atmospheric flow pattern running predominantly west to east along latitudinal lines. When the jet stream is zonal, it's relatively flat and fast-moving, producing a steady parade of weaker, fast-moving storms rather than big, dramatic weather events. Good for consistent but unspectacular skiing.
Mono Lake Convergence Zone
Also: Mono Lake convergence, convergence zone
A local weather phenomenon where two prevailing flows collide in the Mono Lake Basin during storms: cold easterly flow from the Great Basin meets the moisture flow coming over the Sierra from the Pacific. This collision of air masses, combined with extra moisture from the relatively warm, never-frozen Mono Lake, can produce surprising and localized snow and precipitation patterns on the east side.
Santa Ana Winds
Also: Santa Ana, Santa Anas
Hot, dry winds out of the north or east that are a major wildfire concern in Southern California. Driven by high pressure over the Great Basin pushing air downslope toward the coast—as the air descends, it compresses and heats up (adiabatic warming), resulting in extremely dry, gusty conditions. Inside sliders that miss their moisture can sometimes trigger Santa Ana–type events on the east side.
Orographic Lift
Also: orographic, orographics, orographically
Enhancement in precipitation caused by moist air being forced upward as it encounters terrain like a mountain range. As the air rises, it cools and condenses, producing clouds and precipitation. The western slope of the Sierra gets 2–4x the snow of the east slope due to this uplift geometry. Mammoth is orographically favored because it sits at the head of a southwest-facing canyon (the Middle Fork of the San Joaquin), which funnels moisture uphill. Most atmospheric rivers carry moisture from the southwest, so this alignment is ideal. With southerly flow, however, Mammoth's orographics are poor and it tends to underperform.
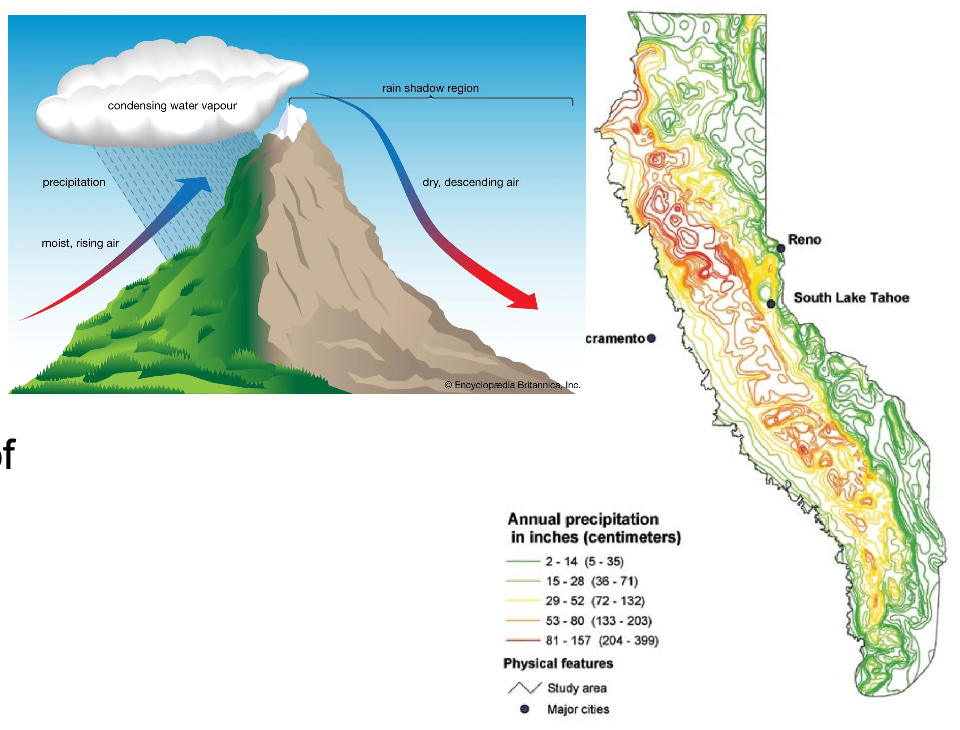
Rain Shadow
Also: rain shadow, rainshadow
The dry zone on the downwind (lee) side of a mountain range. As moist air rises over the mountains, it dumps most of its precipitation on the windward side (orographic lift). By the time the air descends on the other side, it's been wrung dry. The Eastern Sierra and Owens Valley are one of the most dramatic rain shadow zones on Earth—Bishop gets about 5 inches of precipitation per year while the Sierra crest just 15 miles west gets over 50 inches. This is why the east side is high desert.
Sudden Stratospheric Warming
Also: sudden stratospheric warming, stratospheric warming, polar vortex, Rossby wave, Rossby wave breaking
When large planetary waves (Rossby waves) propagate upward and break in the stratosphere, they can disrupt or split the polar vortex—the ring of cold air that normally sits over the Arctic. This causes a rapid warming of the stratosphere (sometimes 50°C+ in days). The effects then propagate downward over weeks, leading to dramatic pattern changes at the surface: cold air outbreaks, major storm track shifts, and sometimes prolonged active weather. Models struggle to capture these events until they're nearly imminent because the signal starts so high up.
Temperature Inversion
Also: inversion, inversions
A layer of the atmosphere where temperature increases with altitude instead of the normal decrease. In the Owens Valley, inversions are common in winter—cold air pools on the valley floor while warmer air sits above. This can mean freezing fog and sub-zero temps in Bishop while it's 20°F warmer at Mammoth's base lodge. Inversions also trap pollutants and limit visibility. For skiers, a strong inversion means you might drive through a fog layer into bluebird skies above.
Lenticular Cloud
Also: lenticular, lenticulars, wave cloud, wave clouds
Lens-shaped or saucer-shaped clouds that form on the lee side of mountain ranges when stable air flows over the terrain and creates standing waves. Extremely common over the Eastern Sierra and a hallmark of the landscape. While they look dramatic (people frequently mistake them for UFOs), they indicate strong winds aloft. For skiers, lenticulars often mean wind hold on upper lifts. For forecasters, they're a visual indicator that the jet stream is nearby and moving fast.
Summer Weather
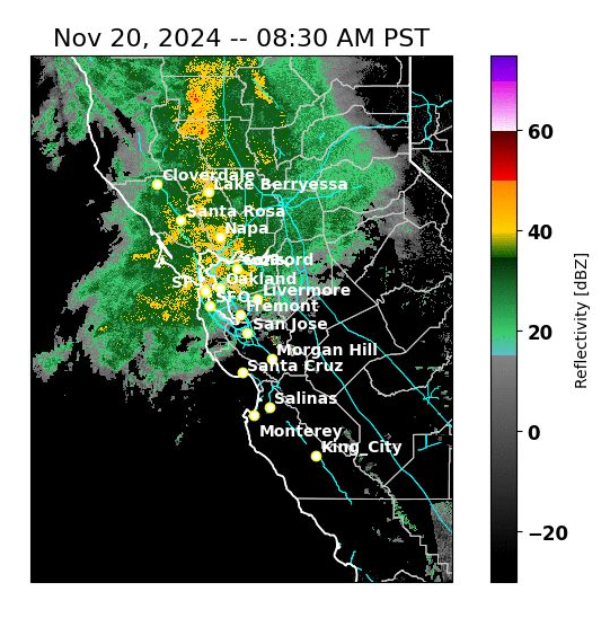
Radar
Gives you real-time storm structure: convective bursts, where rain/snow is intensifying or weakening, how much precipitation is left in a storm, where the snow line is, and individual thunderstorm cells and their tracks. It's the earliest indicator of boom or bust from a storm. RadarScope is great for detailed analysis, or the free NWS radar works well too.
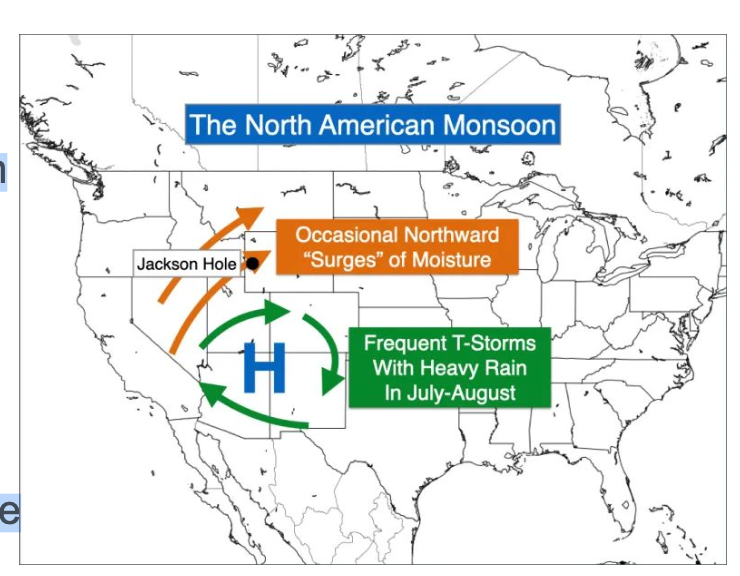
North American Monsoon
Also: monsoon, monsoonal, NAM
Unlike winter storms which are driven by the jet stream, summer thunderstorms get their energy from the sun. Daytime heating combined with moisture over the mountains creates localized areas of rising motion—enough moisture and lift, and you get storms. In the summer, a "four-corners high" pressure system sets up over the desert Southwest. Its clockwise rotation draws moisture from the Gulf of California (Sea of Cortez) northward, fueling significant thunderstorms. Most of the desert Southwest's precipitation occurs during the monsoon. With climate change, monsoonal moisture intrusions into the Sierra may become more frequent.
CAPE (Convective Available Potential Energy)
Also: CAPE, Convective Available Potential Energy
A measure of how much energy is available for thunderstorm updrafts to tap. Over the mountains, it only takes 300–500 J/kg of CAPE to trigger storms when there's moisture and upslope flow—much less than the 1000+ J/kg typically needed over flat terrain. CAPE, combined with mid-level humidity (at 700mb and 500mb), is one of the key parameters for forecasting summer thunderstorms. High CAPE + moisture + daytime heating over mountains = recipe for storms.
Other
Snow to Water Ratio
Also: snow-to-water, snow ratio, Sierra Cement
The ratio of snowfall depth to liquid water equivalent. Sierra Cement—the heavy, dense snow the Sierra is famous for—often comes in at 6–8:1, meaning 6–8 inches of snow per inch of water. The average ratio is about 12:1. Cold, dry powder (think Utah) can reach 15–20:1 or higher. Lower ratios mean heavier, wetter snow that's great for snowpack but tough to ski; higher ratios mean lighter, drier powder.
Snow Level
Also: snow line
The elevation at which precipitation transitions from snow to rain during a storm. The snow level is typically about 1,000 ft below the freezing level, because snowflakes take some time to melt as they fall through above-freezing air. This is critical for the Eastern Sierra—a storm with a snow level at 6,000 ft will dump snow on Mammoth, while the same storm with a snow level at 9,000 ft means rain at the base area and a damaged snowpack. Warm atmospheric rivers push snow levels up; cold storms bring them down.
Freezing Level
Also: freezing level, 0°C level
The altitude in the atmosphere where the temperature drops to 0°C (32°F). Not the same as the snow level—the snow level is typically about 1,000 ft lower because snow takes time to melt as it falls through slightly-above-freezing air. The freezing level determines what kind of precipitation you get at different elevations and is one of the first things to check when a storm is approaching.
Sea Surface Temperature Anomalies
Also: SST, sea surface temperature, SST anomalies
The deviation of sea surface temperatures from their climatological average. SSTs have a major impact on the large-scale weather pattern in a given winter—warmer or cooler ocean waters influence the strength and position of the jet stream, storm development, and moisture availability. ENSO is the most well-known SST anomaly pattern, but regional SST patterns along the West Coast also matter for California storms.
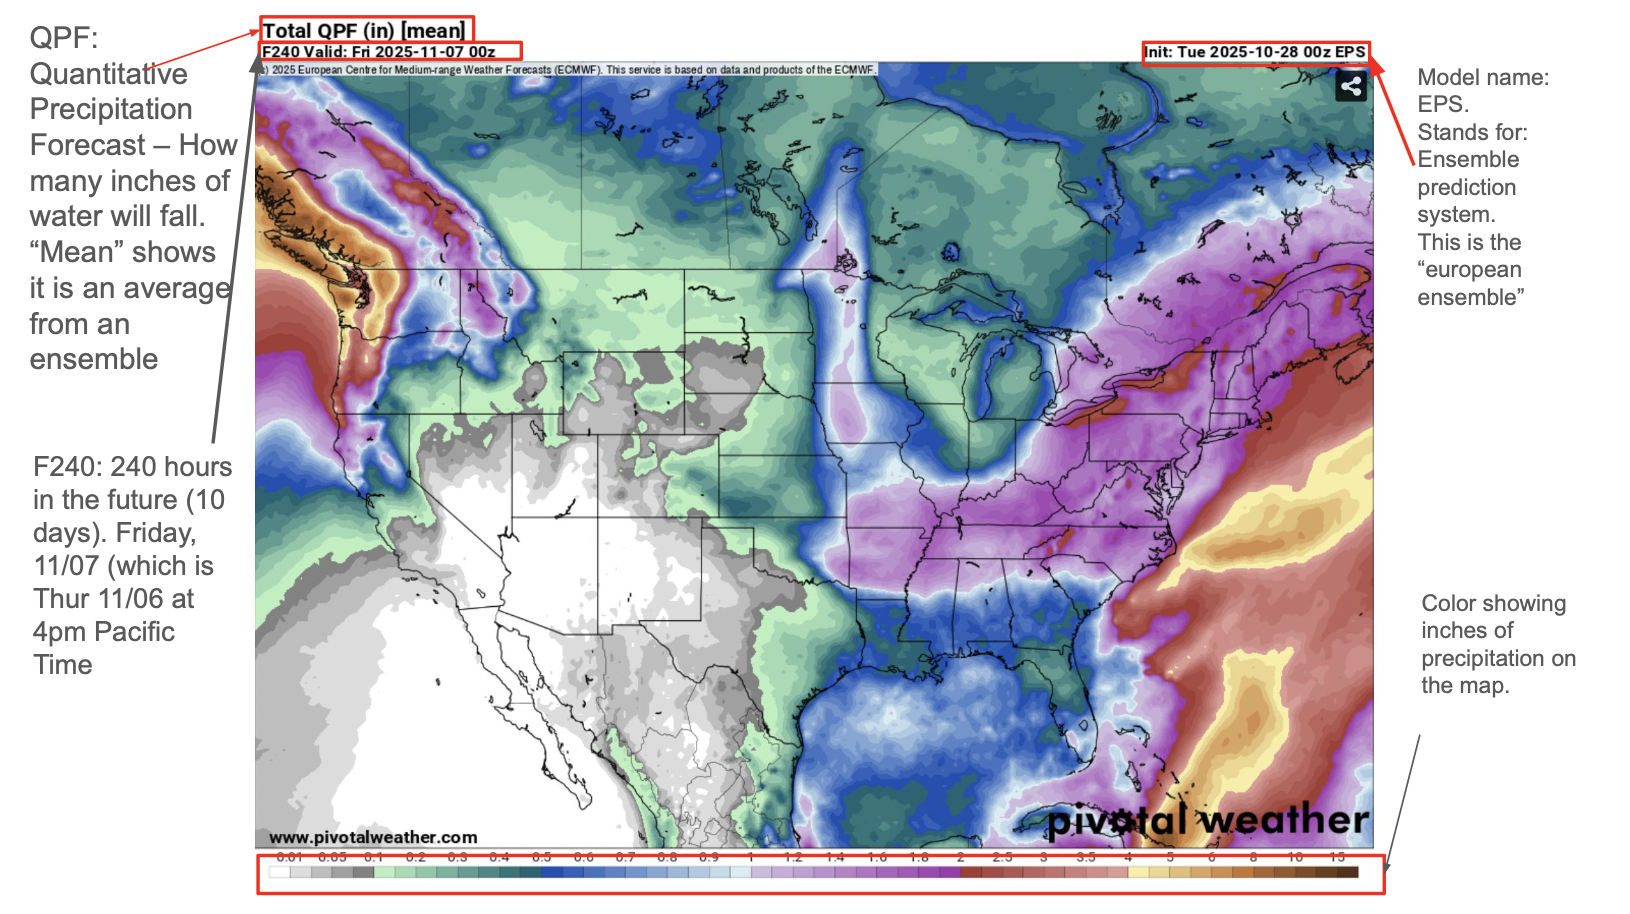
QPF (Quantitative Precipitation Forecast)
Also: QPF
A model chart showing how many inches of liquid water are forecast to fall. When labeled "Mean," it's an average from an ensemble of model runs, which is more reliable than any single deterministic run. QPF is one of the most practical charts for mountain forecasting because it directly tells you how much precipitation to expect—multiply by the snow-to-water ratio to estimate snowfall totals.
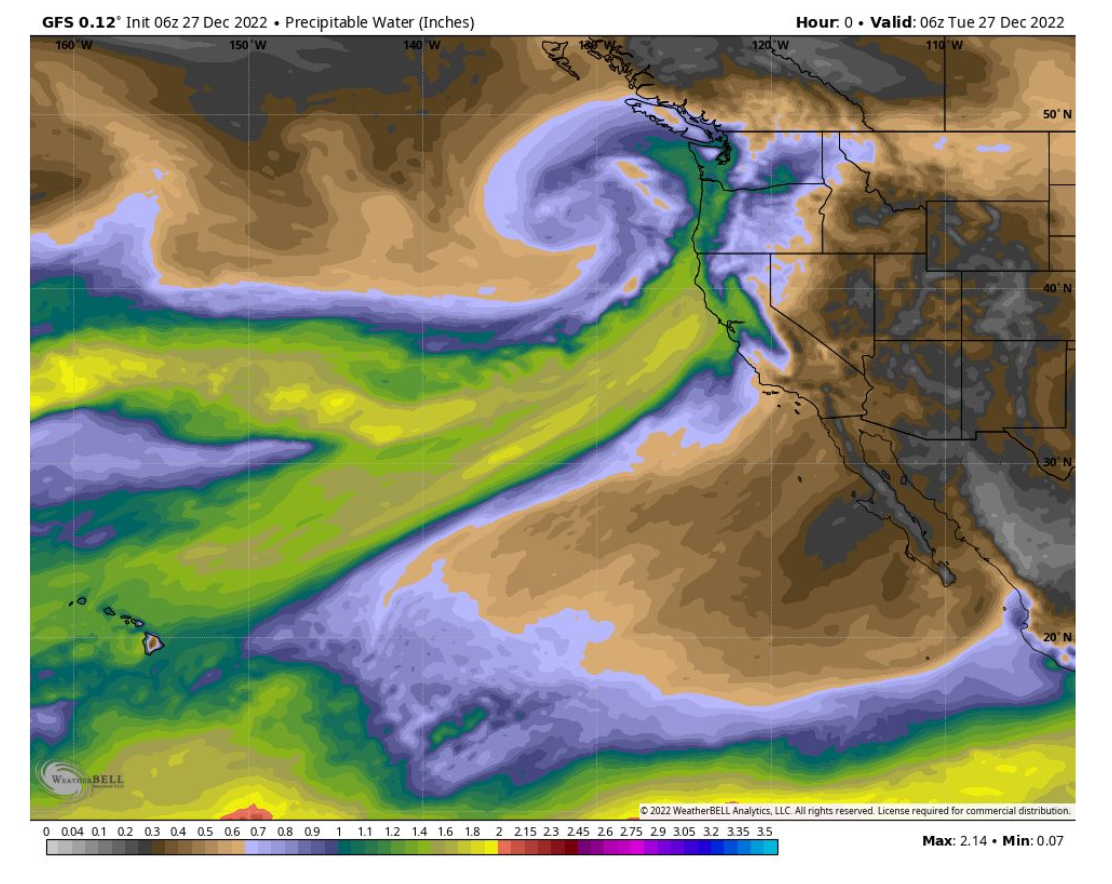
Precipitable Water (PWAT)
Also: precipitable water, PWAT, TPW
The total amount of water vapor in a column of atmosphere from the surface to the top, expressed as inches of liquid water. If you condensed every drop of moisture in the air above you, that's the PWAT value. Values above 1 inch for the Sierra region indicate a moist airmass, and values above 1.5 inches often accompany atmospheric rivers. PWAT charts are one of the easiest ways to visualize where the moisture is and where it's headed.
Snow Water Equivalent (SWE)
Also: SWE, snow water equivalent
The amount of liquid water contained in the snowpack—if you melted the entire snowpack, how deep would the water be? SWE is the most important metric for water supply forecasting and snowpack health. A deep snowpack with low SWE (light, fluffy snow) is less valuable for water storage than a shallower pack with high SWE (dense, wet snow). California's water supply depends heavily on Sierra SWE, which is tracked by SNOTEL and CDEC sensors.
Isothermal Snowpack
Also: isothermal
When the entire snowpack reaches 32°F (0°C) from top to bottom. This happens during warm storms or prolonged warm weather, especially with rain-on-snow events. An isothermal pack is saturated and can't refreeze internally—water percolates through and the snow becomes heavy and structurally weak. For skiers, it means wet, heavy conditions and increased wet-slide avalanche risk. The pack needs sustained cold temps to refreeze and stabilize. In spring, daily isothermal cycling (warm days, cold nights) produces corn snow.
Corn Snow
Also: corn, spring corn, corn snow
The holy grail of spring skiing. Corn forms through a daily freeze-thaw cycle: the snow surface melts during the day, then refreezes overnight into a hard crust. The next morning, as the sun warms the surface, the top layer softens into perfectly smooth, granular snow that's a blast to ski. Timing is everything—too early and you're on bulletproof ice, too late and you're in slush. South-facing aspects corn up first, followed by west-facing, then east-facing slopes.
Wind Loading
Also: wind loaded, wind-loaded, wind loading
The process of wind transporting snow from exposed (windward) terrain and depositing it on sheltered (leeward) terrain, creating slabs and pillows. Wind loading can add significant depth to lee-side slopes, often creating the best skiing—but also the most dangerous avalanche conditions. On the Sierra crest, prevailing westerly winds load east-facing bowls and chutes. If the wind is howling from the west, east-facing terrain is likely getting loaded and should be approached with caution.