Cutoff Low Season! And, a Remarkably Wet Looking Winter Signal?
Overview
My friends...
Dry and mild fall weather is favored for the next five or so days, and fall color is peaking at most of the higher elevations. Take these nice days to get out and do some peepin', because color may not last much longer with cold and gusty weather on the horizon.
Around October 20th, another trough is trending likelier. This would bring colder air from the north, and models also indicate a chance that it becomes cutoff and stalls over the SW / California. Right now, modeling suggests a wide range of precipitation outcomes, but it looks like a weak to moderate storm, not enough to get things started for the ski season. This is also setting up to be another volatile forecast, so things will fluctuate over the coming days.
Longer range, it appears that the troughing pattern could continue as the southern branch of the pacific jetstream looks likely to remain active. In addition, a wet November signal keeps showing up on extended modeling, and our historic strength El Niño continues barreling into uncharted territory. The current outlook in seasonal models shows a remarkably high chance of a very wet winter across the entire state of California...
Cutoff Low Season!
Our troughy pattern wants to keep replaying itself. Models are bought into the idea of another trough diving down towards California around October 20th, and agreement in the synoptic pattern is quite high.
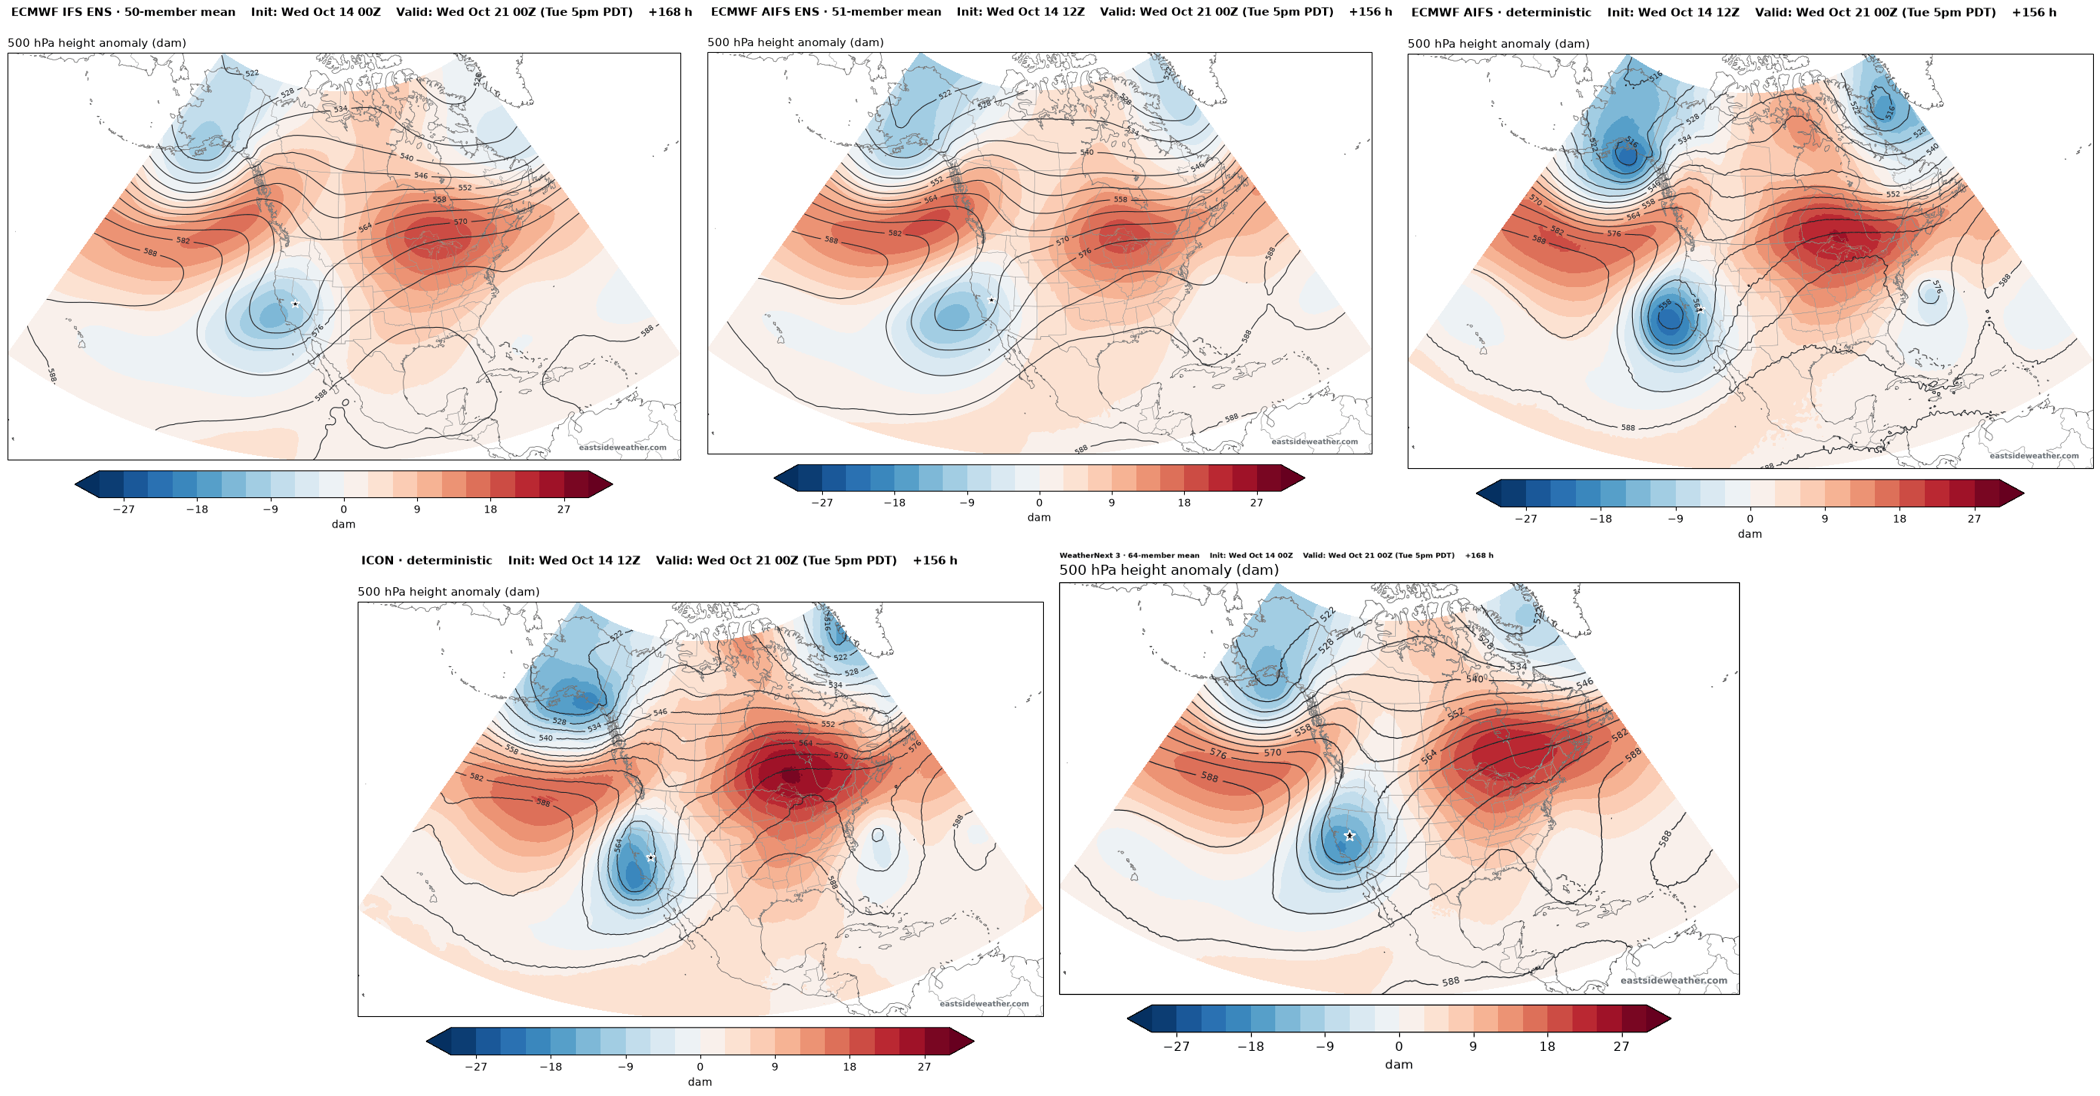
Models are trending deeper and deeper with this low, and also show it becoming a cutoff low.
Cutoff lows are called so because they are cut off from the main flow of the atmosphere. Without the jet stream to steer them, they tend to wobble around, stall, and drift in ways the models struggle to pin down. This makes the forecast particularly volatile, because if it takes a track over land, we get cold weather, gusty north winds here on the Eastside, and Santa Ana winds in Southern California. If it stalls out to sea before pushing inland, we'll get next to no precipitation. But if the timing is right, we could see a more substantial storm.
Cutoff lows occur much more commonly in the fall and spring than in mid-winter. In the winter, the jet stream is strong and zonal, meaning it runs fairly straight from west to east, and the strong background westerlies keep storms moving along. In the transition seasons, the jet is weaker and wavier, and the background westerlies are not strong enough to carry a low along, so it is easier for one to pinch off and sit.
Slight variations in the track and timing of the low will be the difference between disappointment and our first "real" snowstorm of the season, which we are all eagerly awaiting now.
But How Much Snow??
Below are the WeatherNext 3 percentiles for total precipitation through Thursday evening. The 10th percentile is the drier end of its 64 members, and the 90th is the wetter end:
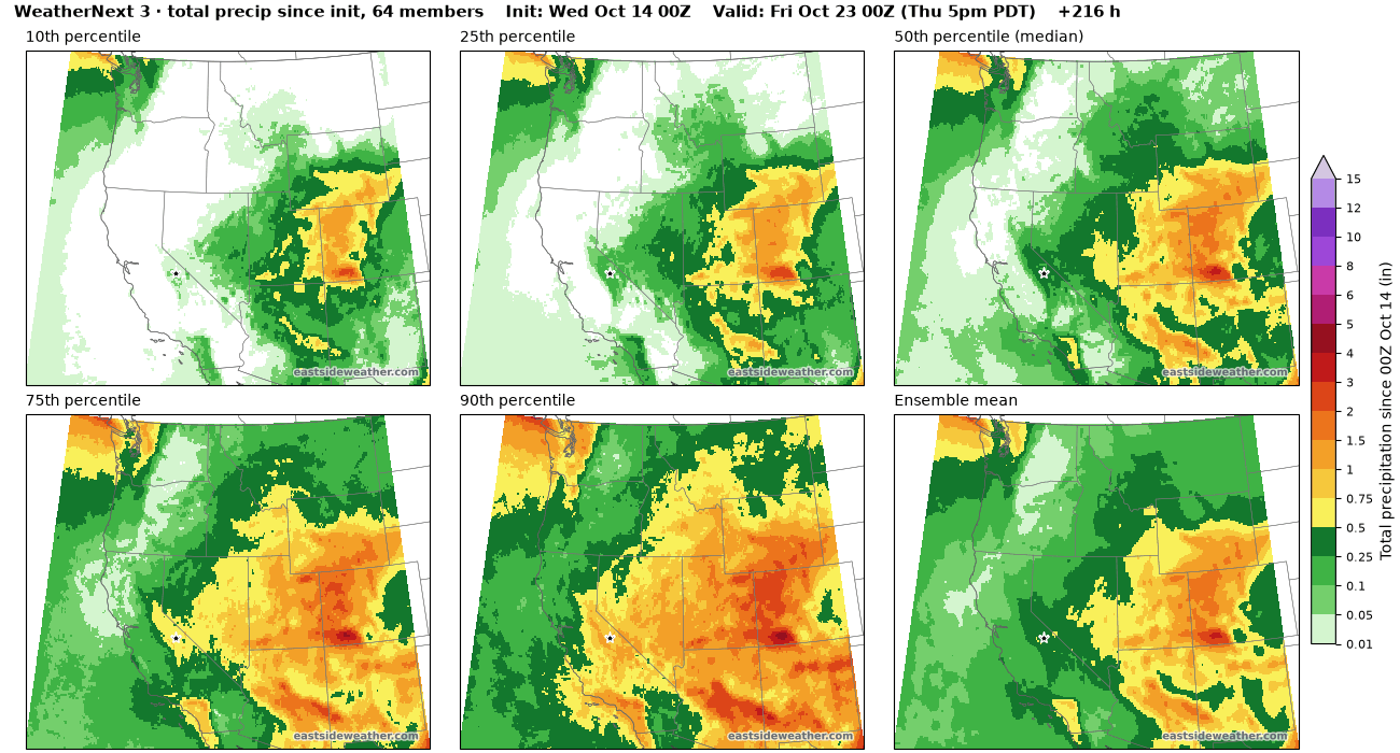
WeatherNext 3 data accessed through Google Cloud Storage. © 2024-6 Google LLC, whose machine learning models were used to create the experimental data made available under the following licence terms https://storage.googleapis.com/weathernext-public/terms-of-use.pdf. This data is intended for experimental modelling only and is not intended, validated, or approved for real world use.
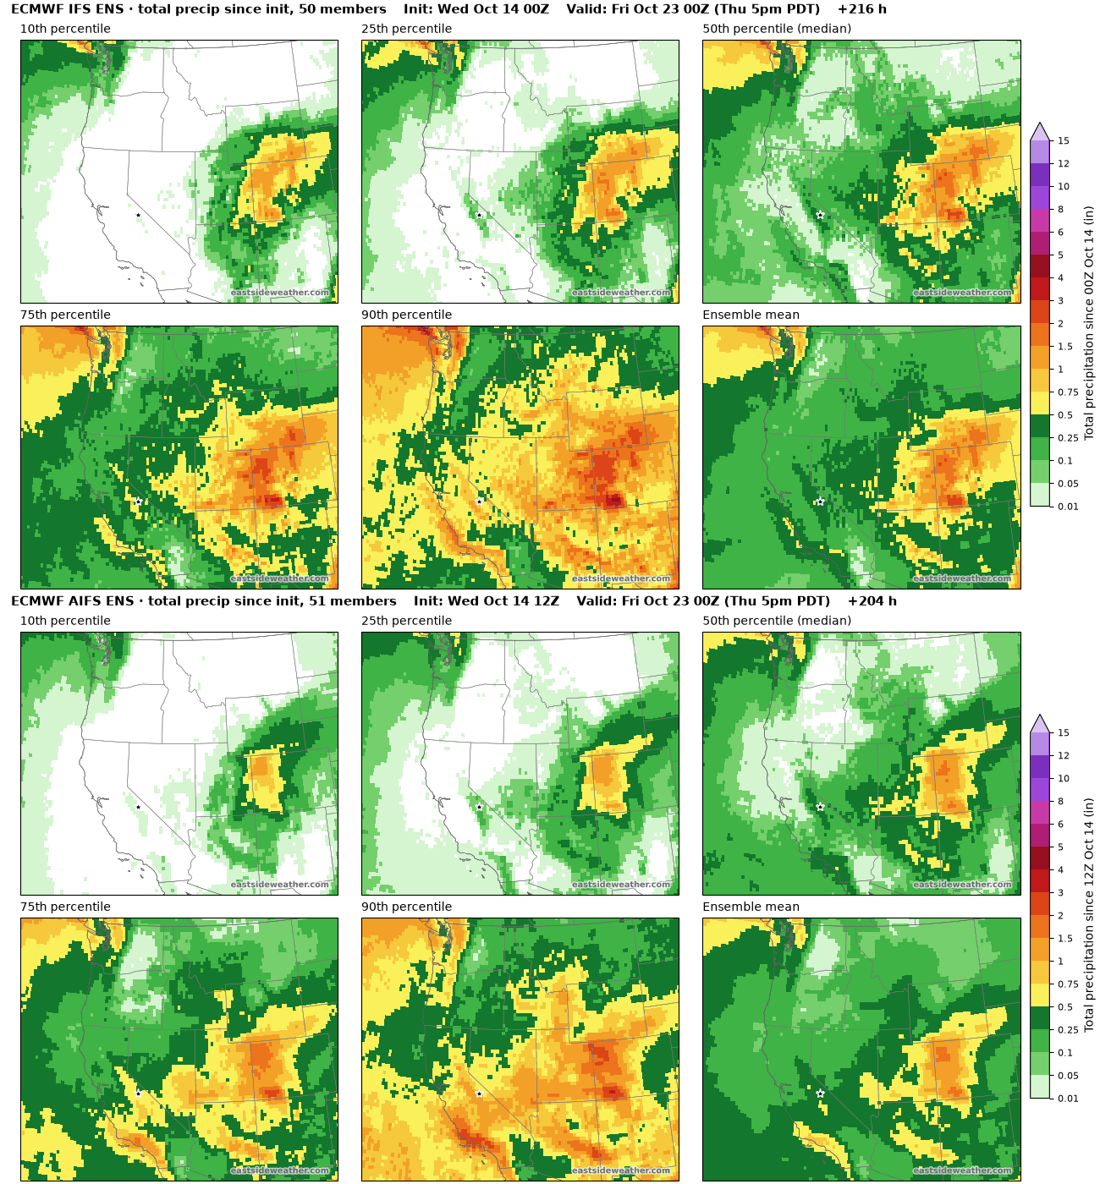
Notice how the drier members keep the Eastern Sierra nearly dry, while the wetter members bring us somewhere around half an inch to an inch of liquid. Most of the precipitation in all of these models ends up to our east, over Utah, Colorado and Arizona. The Euro ensemble and the Euro AI ensemble also show a similar spread, although all models are trending up in recent runs... The trend is your friend!
The latest AIFS operational model shows pretty modest precipitation totals, but substantially more than we've seen all season. Something to watch!
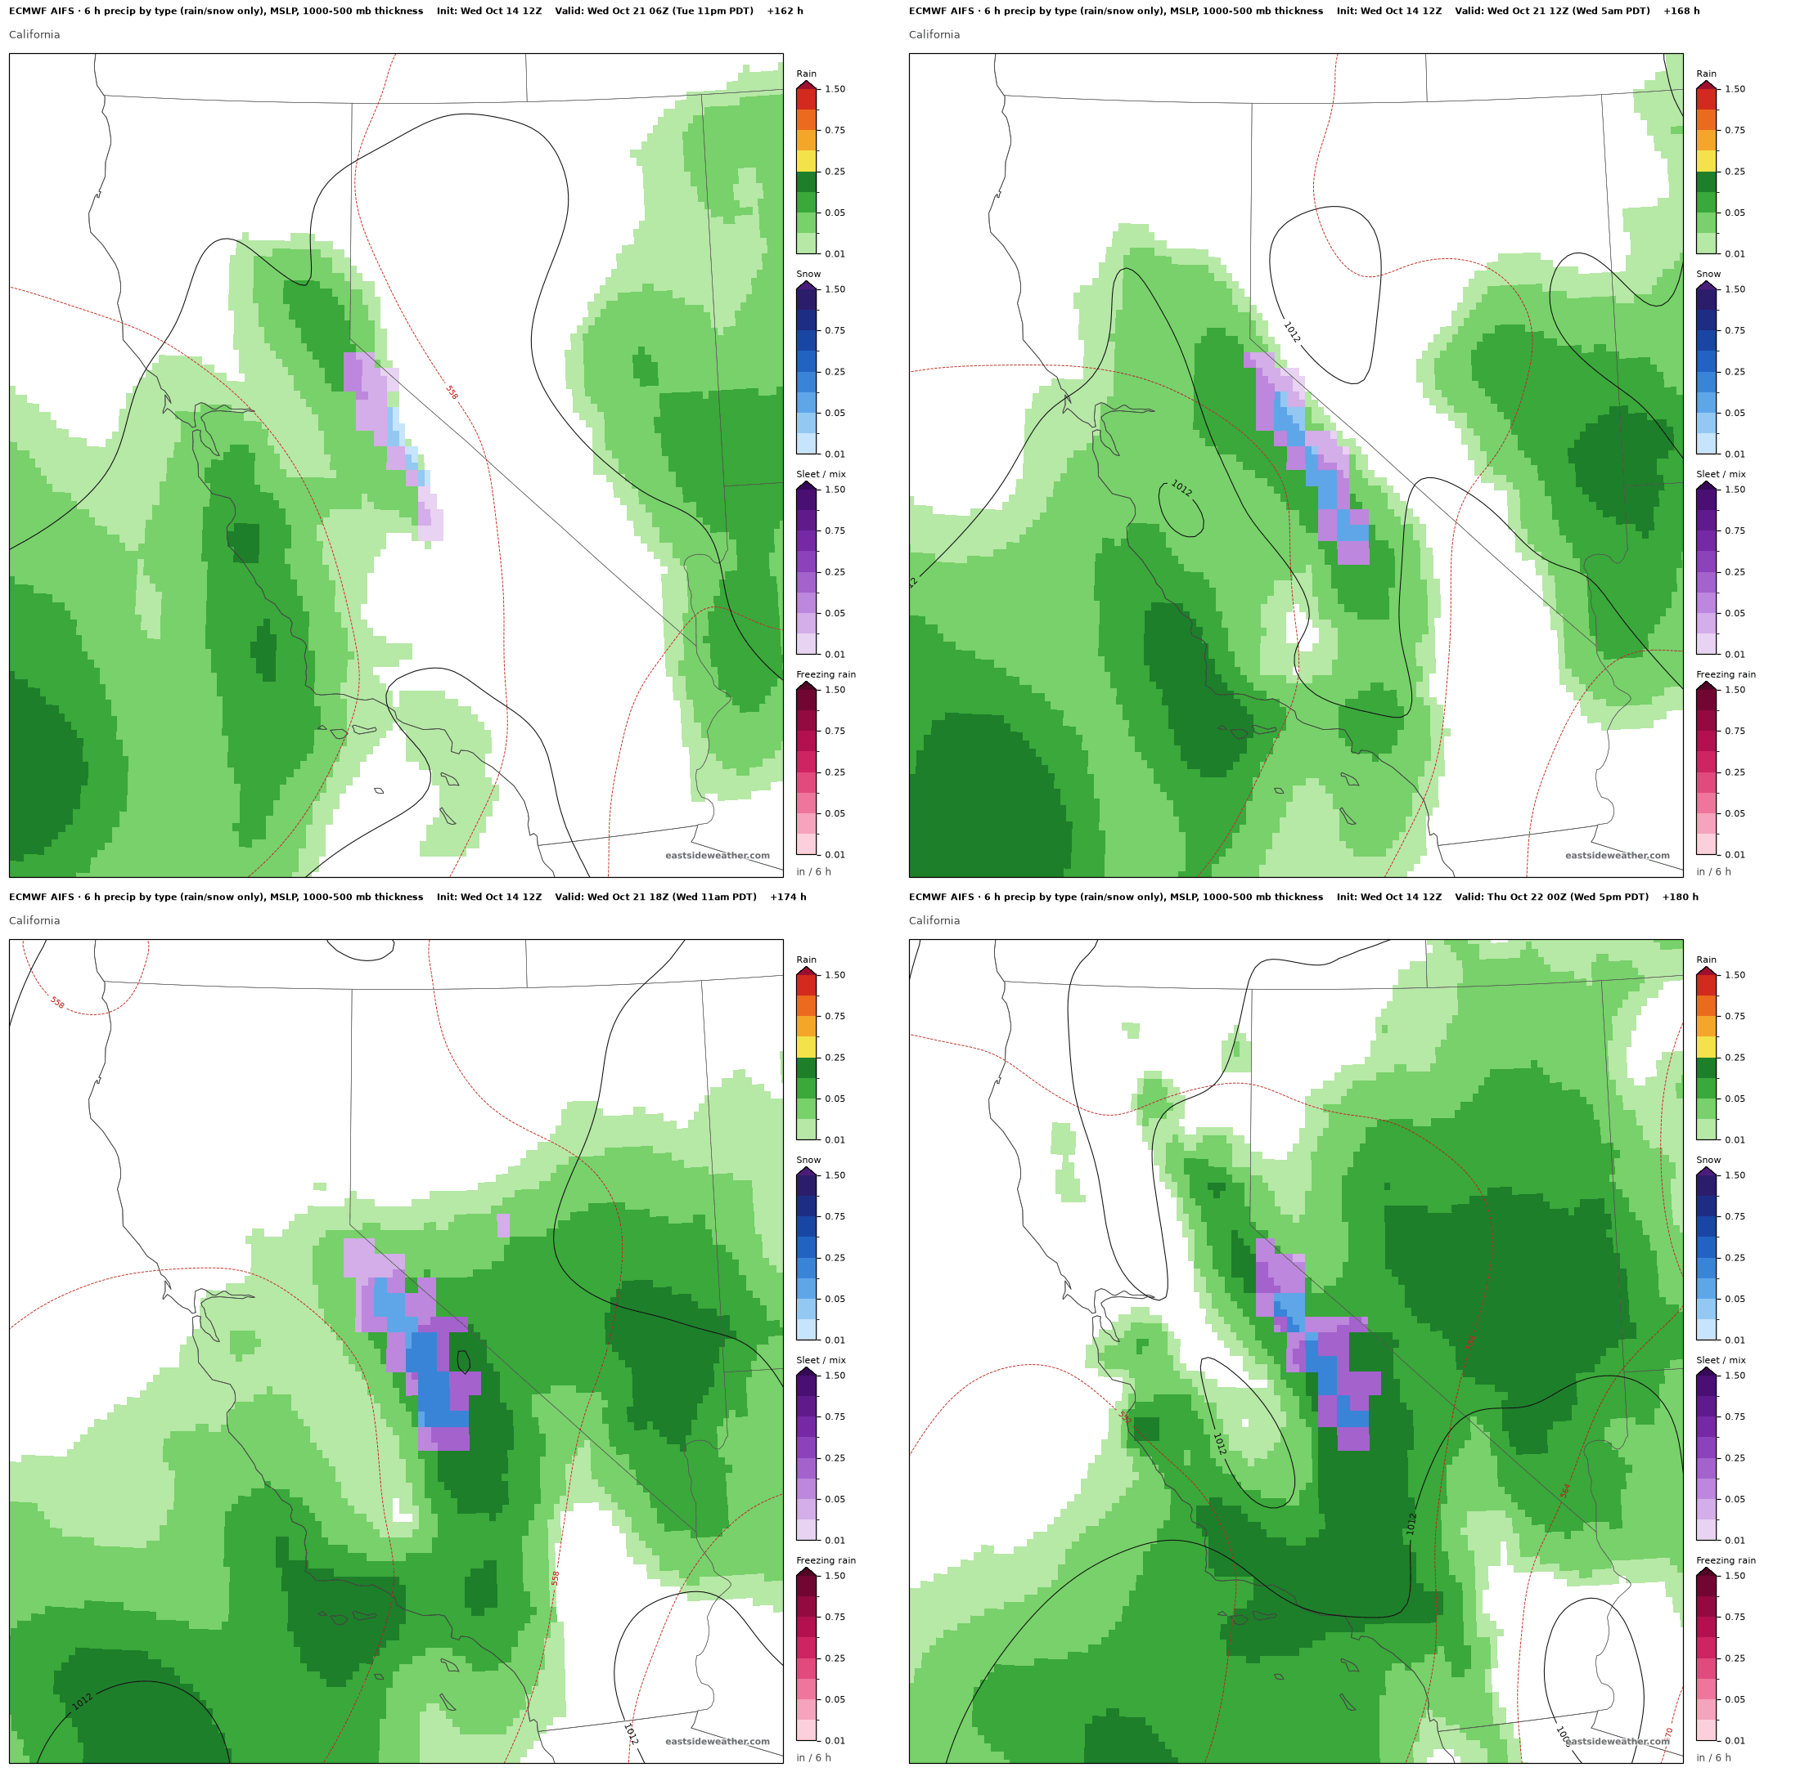
We're watching closely to see which direction this trends, but right now modeling suggests somewhere between another dusting and several inches of snow. Not enough to get things started quite yet!
Another Trough Reloading?
Longer range, there are early indications that the pattern may reload around the 27th through the 29th. Both the Euro AI and Euro ensembles build a ridge over the Gulf of Alaska and western Canada, with troughing sneaking in underneath the ridge. A somewhat classic El Niño track, possibly steered in by the subtropical jet.
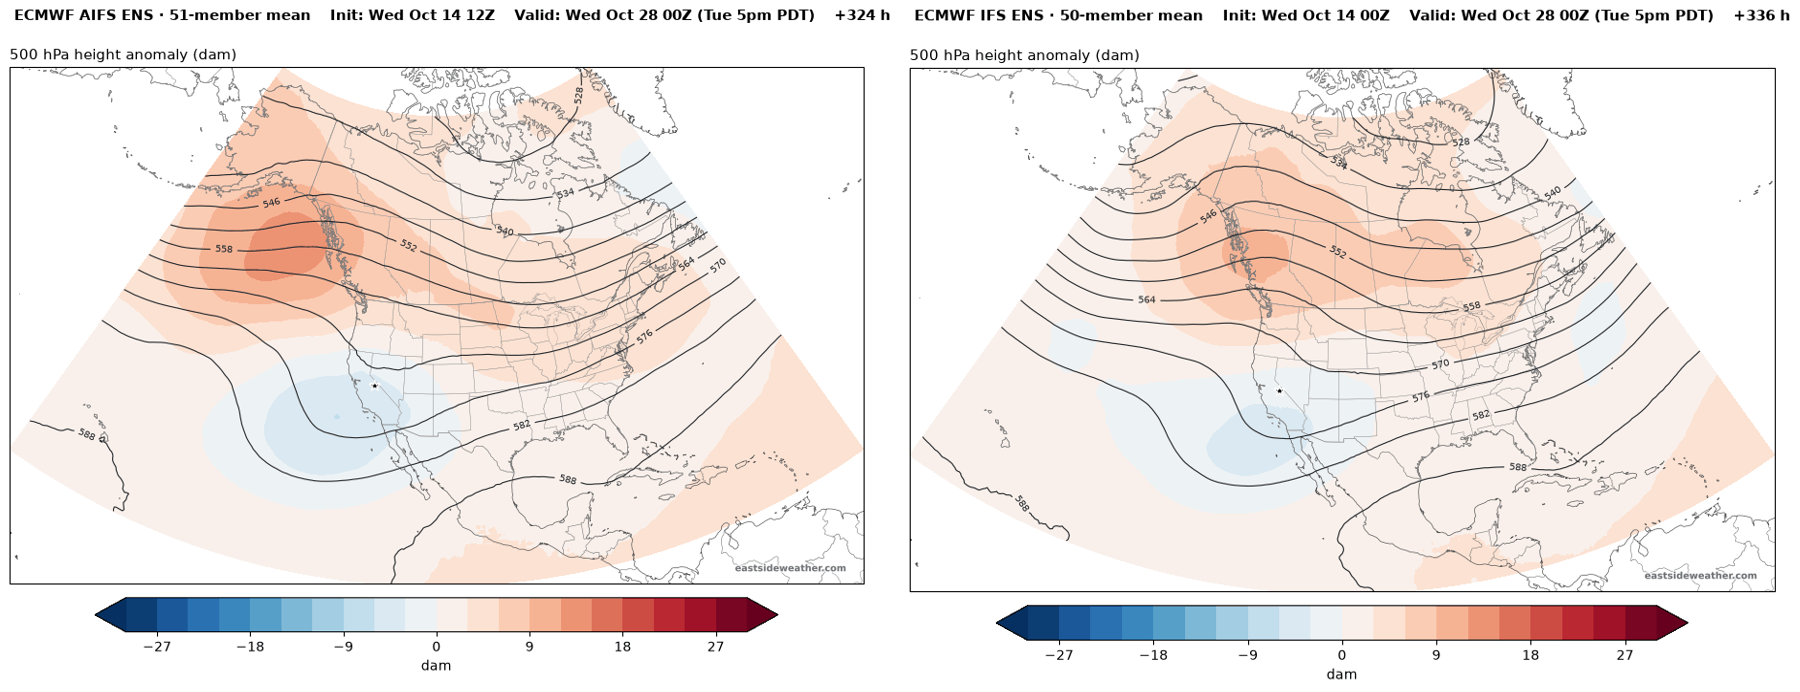
Personally, I'm starting to believe that the subtropical jet wants to print out a few more cutoff lows over the next few weeks. But that's speculative, and time will tell. The main thing we're watching here is to see if we can get one to strengthen off the coast enough to bring in significant precipitation, rather than tracking over the Great Basin and bringing us gusty north winds and Southern California its Santa Anas.
An Emerging Signal for a Wet November
Beyond next week, long range modeling has been suggesting a wet November for quite some time. The ECMWF extended range weeklies have been showing a wetter than normal signal for California going into November, and it has been consistent from run to run, for weeks now...
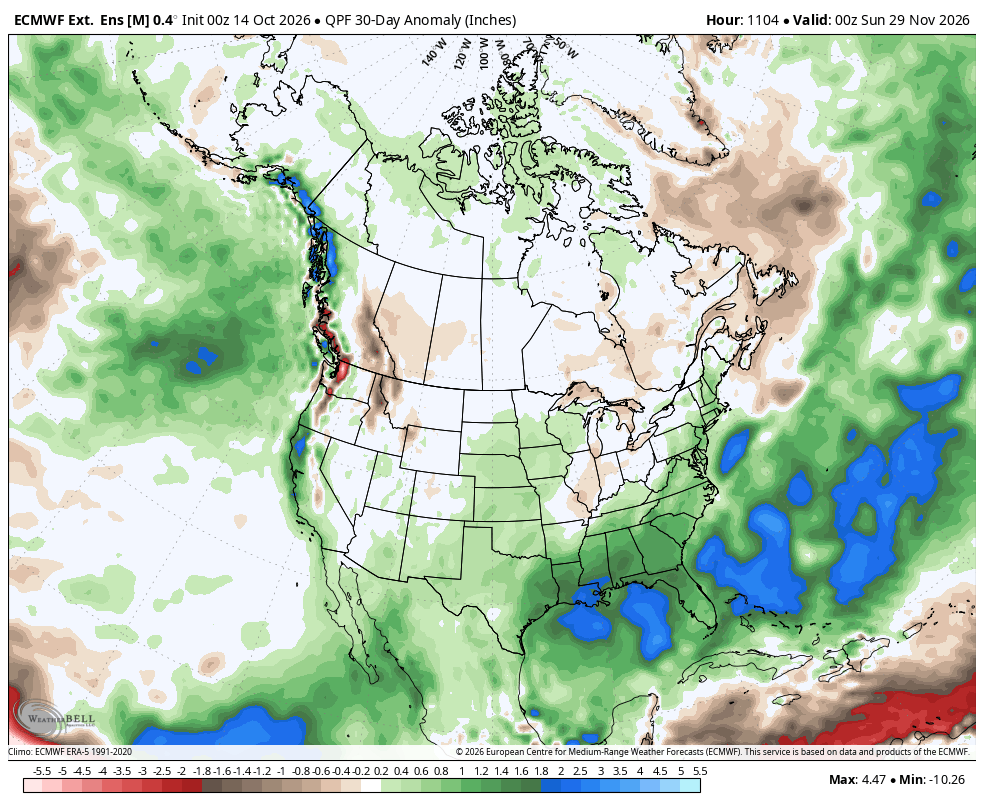
Image: WeatherBell Analytics, ECMWF data.
The seasonal models available on this site show the same thing. Here is the multi-model mean of eight Copernicus seasonal models for November on its own, and for December through February. Notice how the strongest part of the wet signal is backloaded towards January / February. This is common in El Niño years. However, every month from December through March shows up as wetter than average on almost every model.
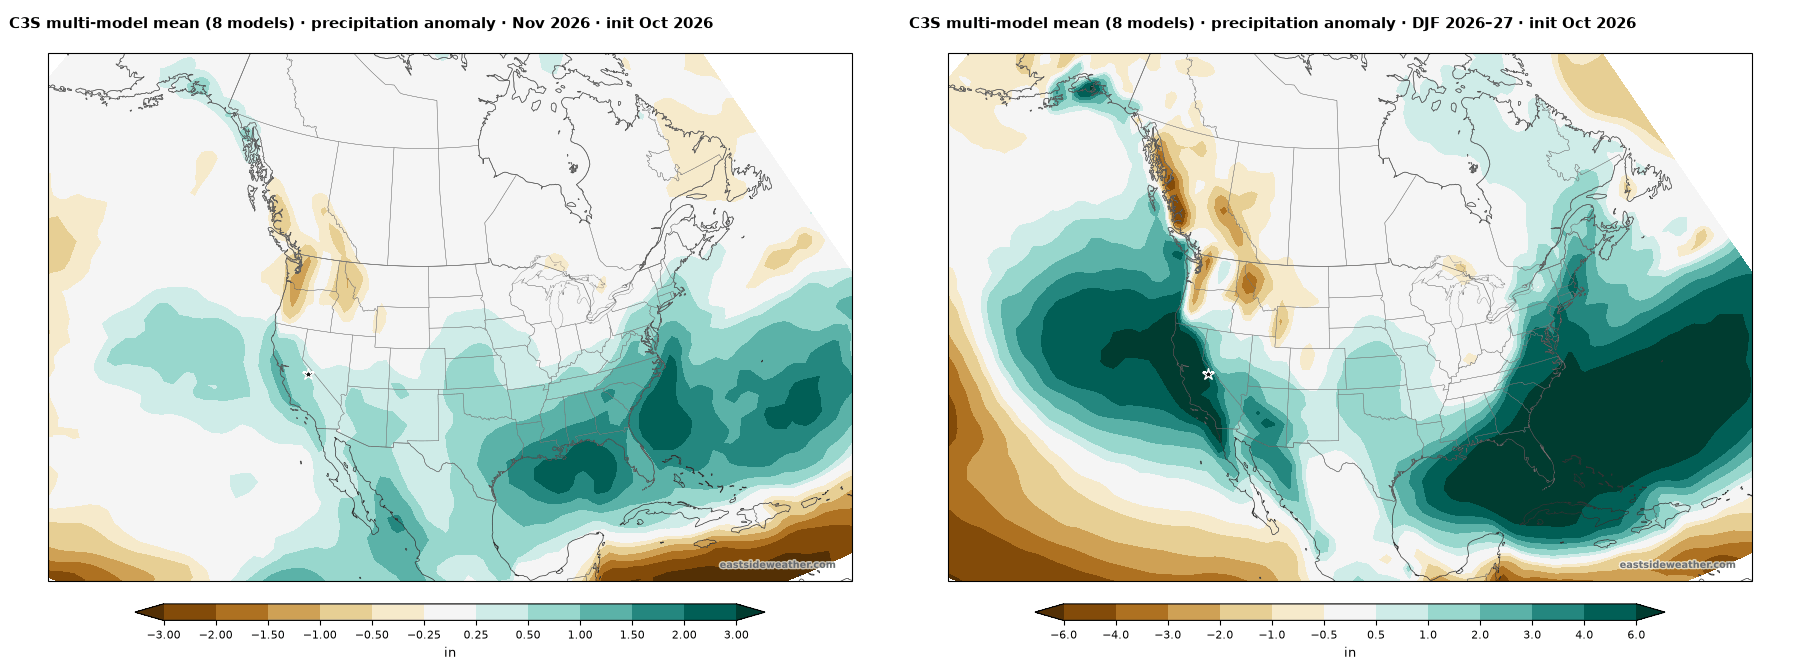
This is the kind of response you would expect from a strong El Niño, where an active southern branch of the jet stream sets up and steers storms into California. You can explore all of these maps, on my Seasonal Outlooks page, including comparing the forecast for anywhere in the US to climatological norms.
Is the Subtropical Jet Waking Up?
One of the hallmarks of a strong El Niño winter is a strong subtropical jet, the southern branch of the jet stream that carries Pacific moisture into California and the southern tier of the country. Looking at the 200 mb wind from the ensembles, there are signs that it is starting to stir by the end of the month.
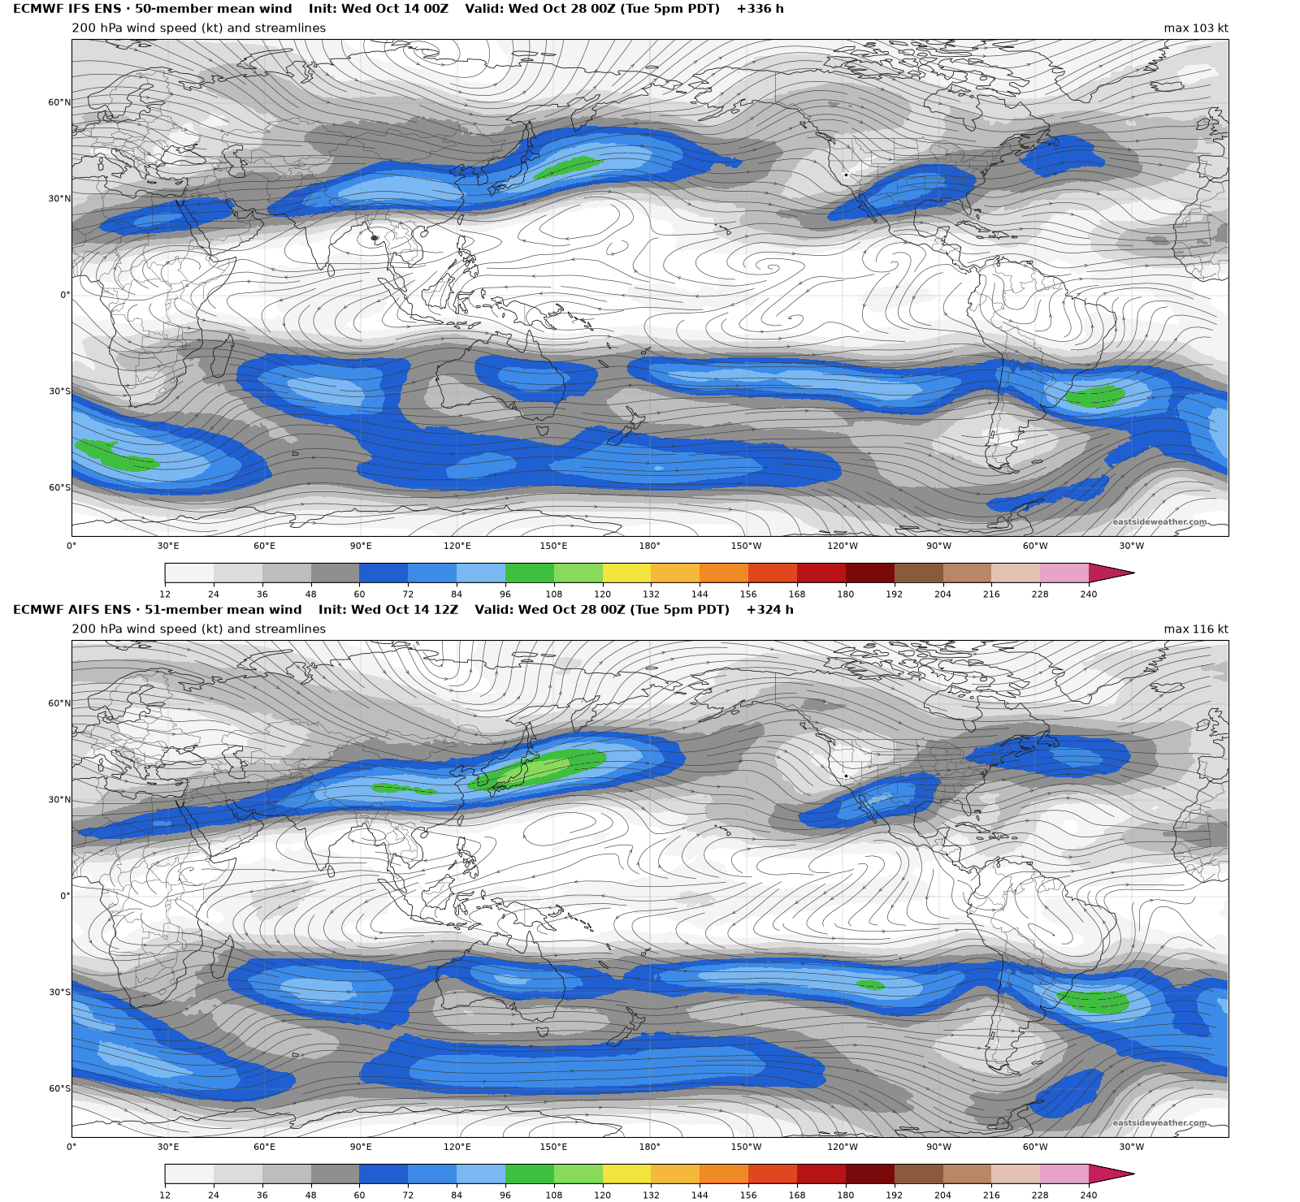
Even in the ensemble mean, which smooths a lot out, you can see a signal for a strong southern branch of the jet aiming towards California. Still a bit early, and it remains to be seen if it will stay this way throughout winter, but this type of signal encourages me on top of what the models are showing.
To be honest though, there is no doubt that this El Niño is remarkably well coupled to the atmosphere, so we shouldn't be surprised when the jet does come roaring.
Below is a video illustrating how the southern jet might work to print out some of those cutoff lows over the next 15 days. As of now, this is just something to watch.
A Historic El Niño Barrels into Uncharted Territory...
Our El Niño continues to grow. Daily sea surface temperatures in the Niño 3.4 region were running about 3.3°C above normal as of October 13, which is record territory, and the event is forecast to peak in December.
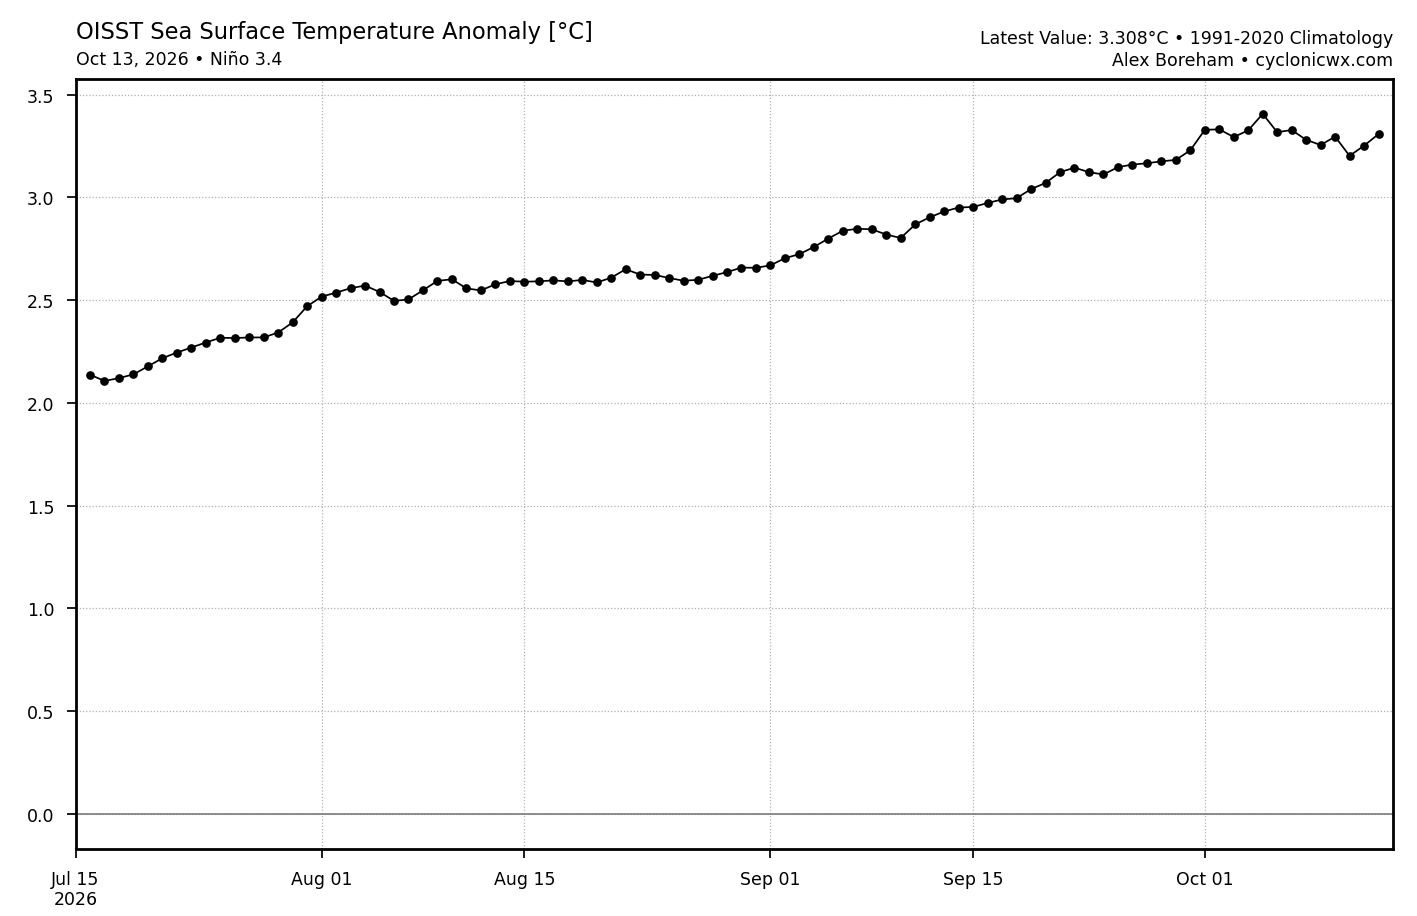
Image: Alex Boreham, cyclonicwx.com.
We are currently seeing the strongest westerly wind burst of this entire El Niño, and the ECMWF keeps it going through the end of October:
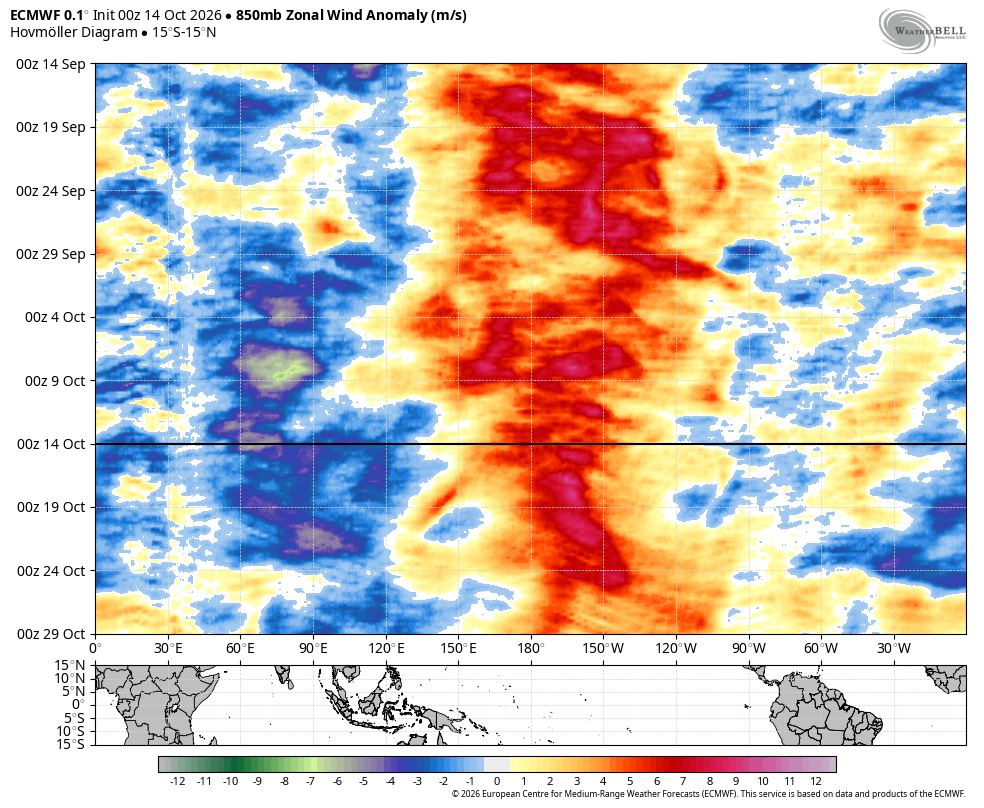
Image: WeatherBell Analytics, ECMWF data.
Westerly wind bursts push warm water eastward and help deepen the warm layer in the eastern Pacific. They are one of the main ways El Niño strengthens. The current subsurface reservoir of heat is unlike anything I've ever seen.
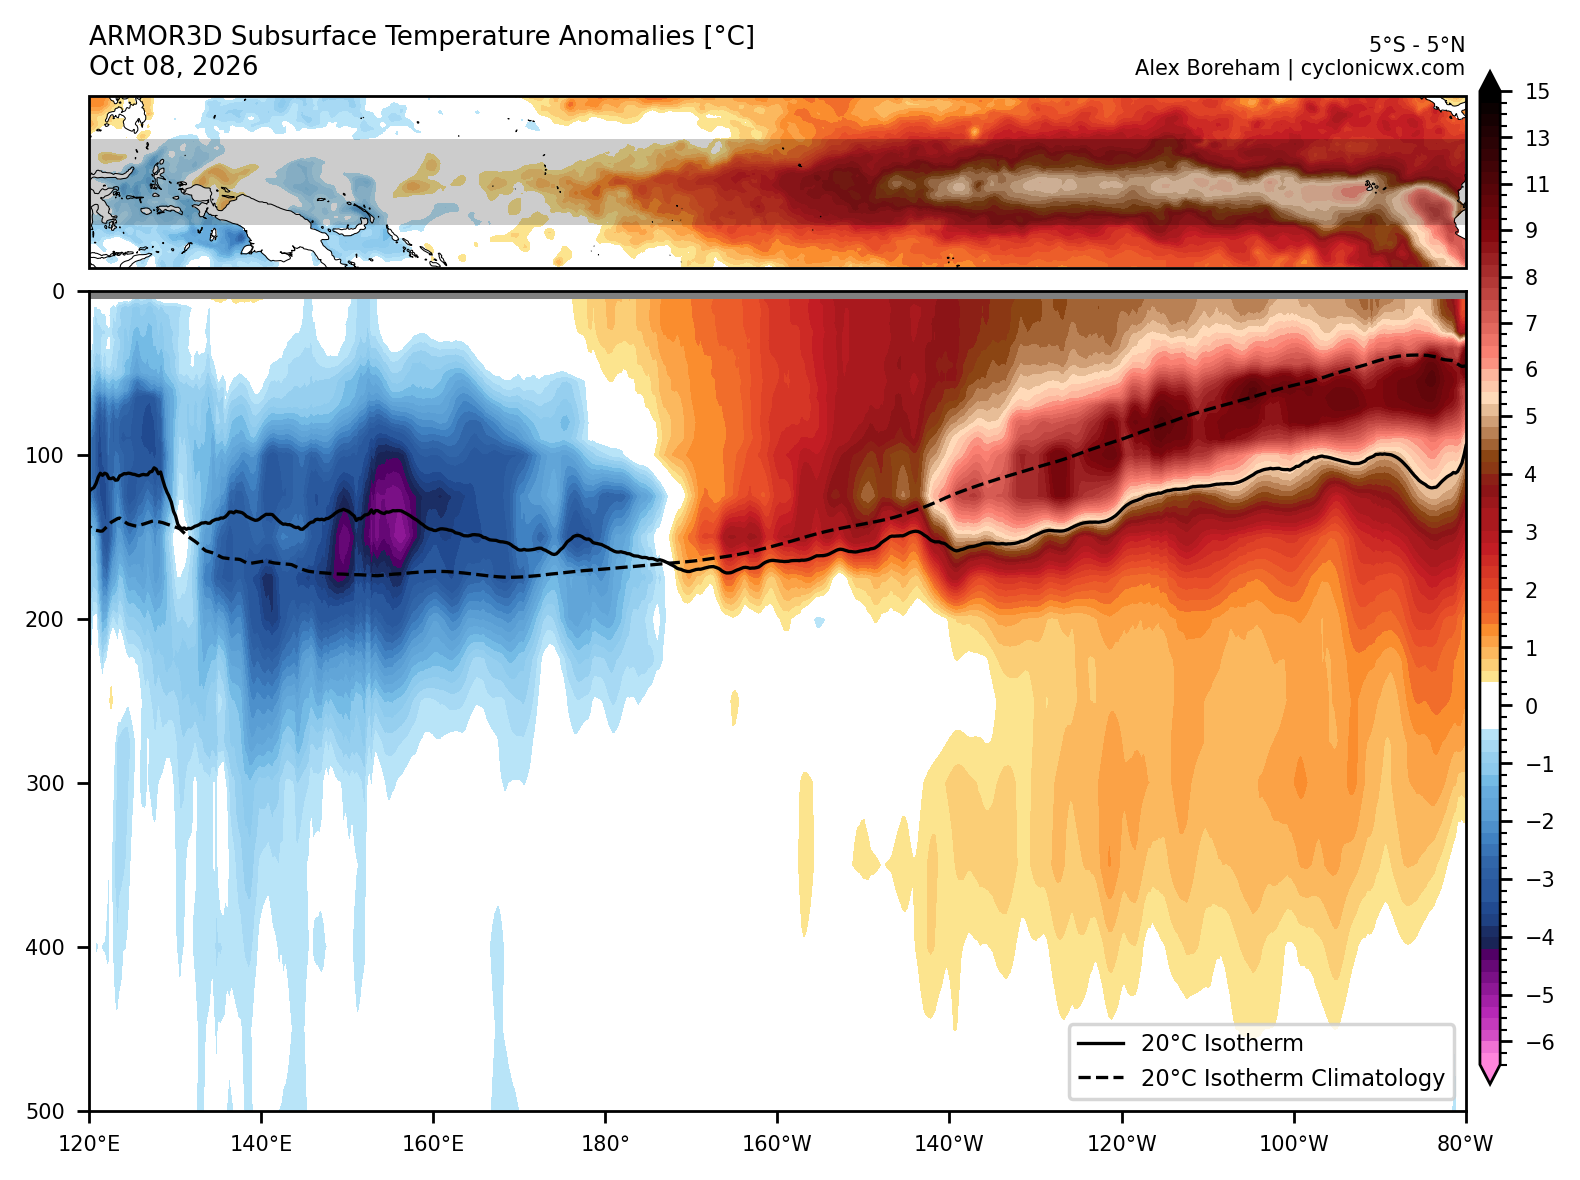
Image: Alex Boreham, cyclonicwx.com.
With this incredible wind burst, El Niño should continue strengthening substantially.
Digging Into Seasonal Modeling
The signal shown across all seasonal models is truly remarkable. I built a page on my site for digging into these. Below is the season total precipitation from every ensemble member of the seasonal models for San Francisco, compared with the average.
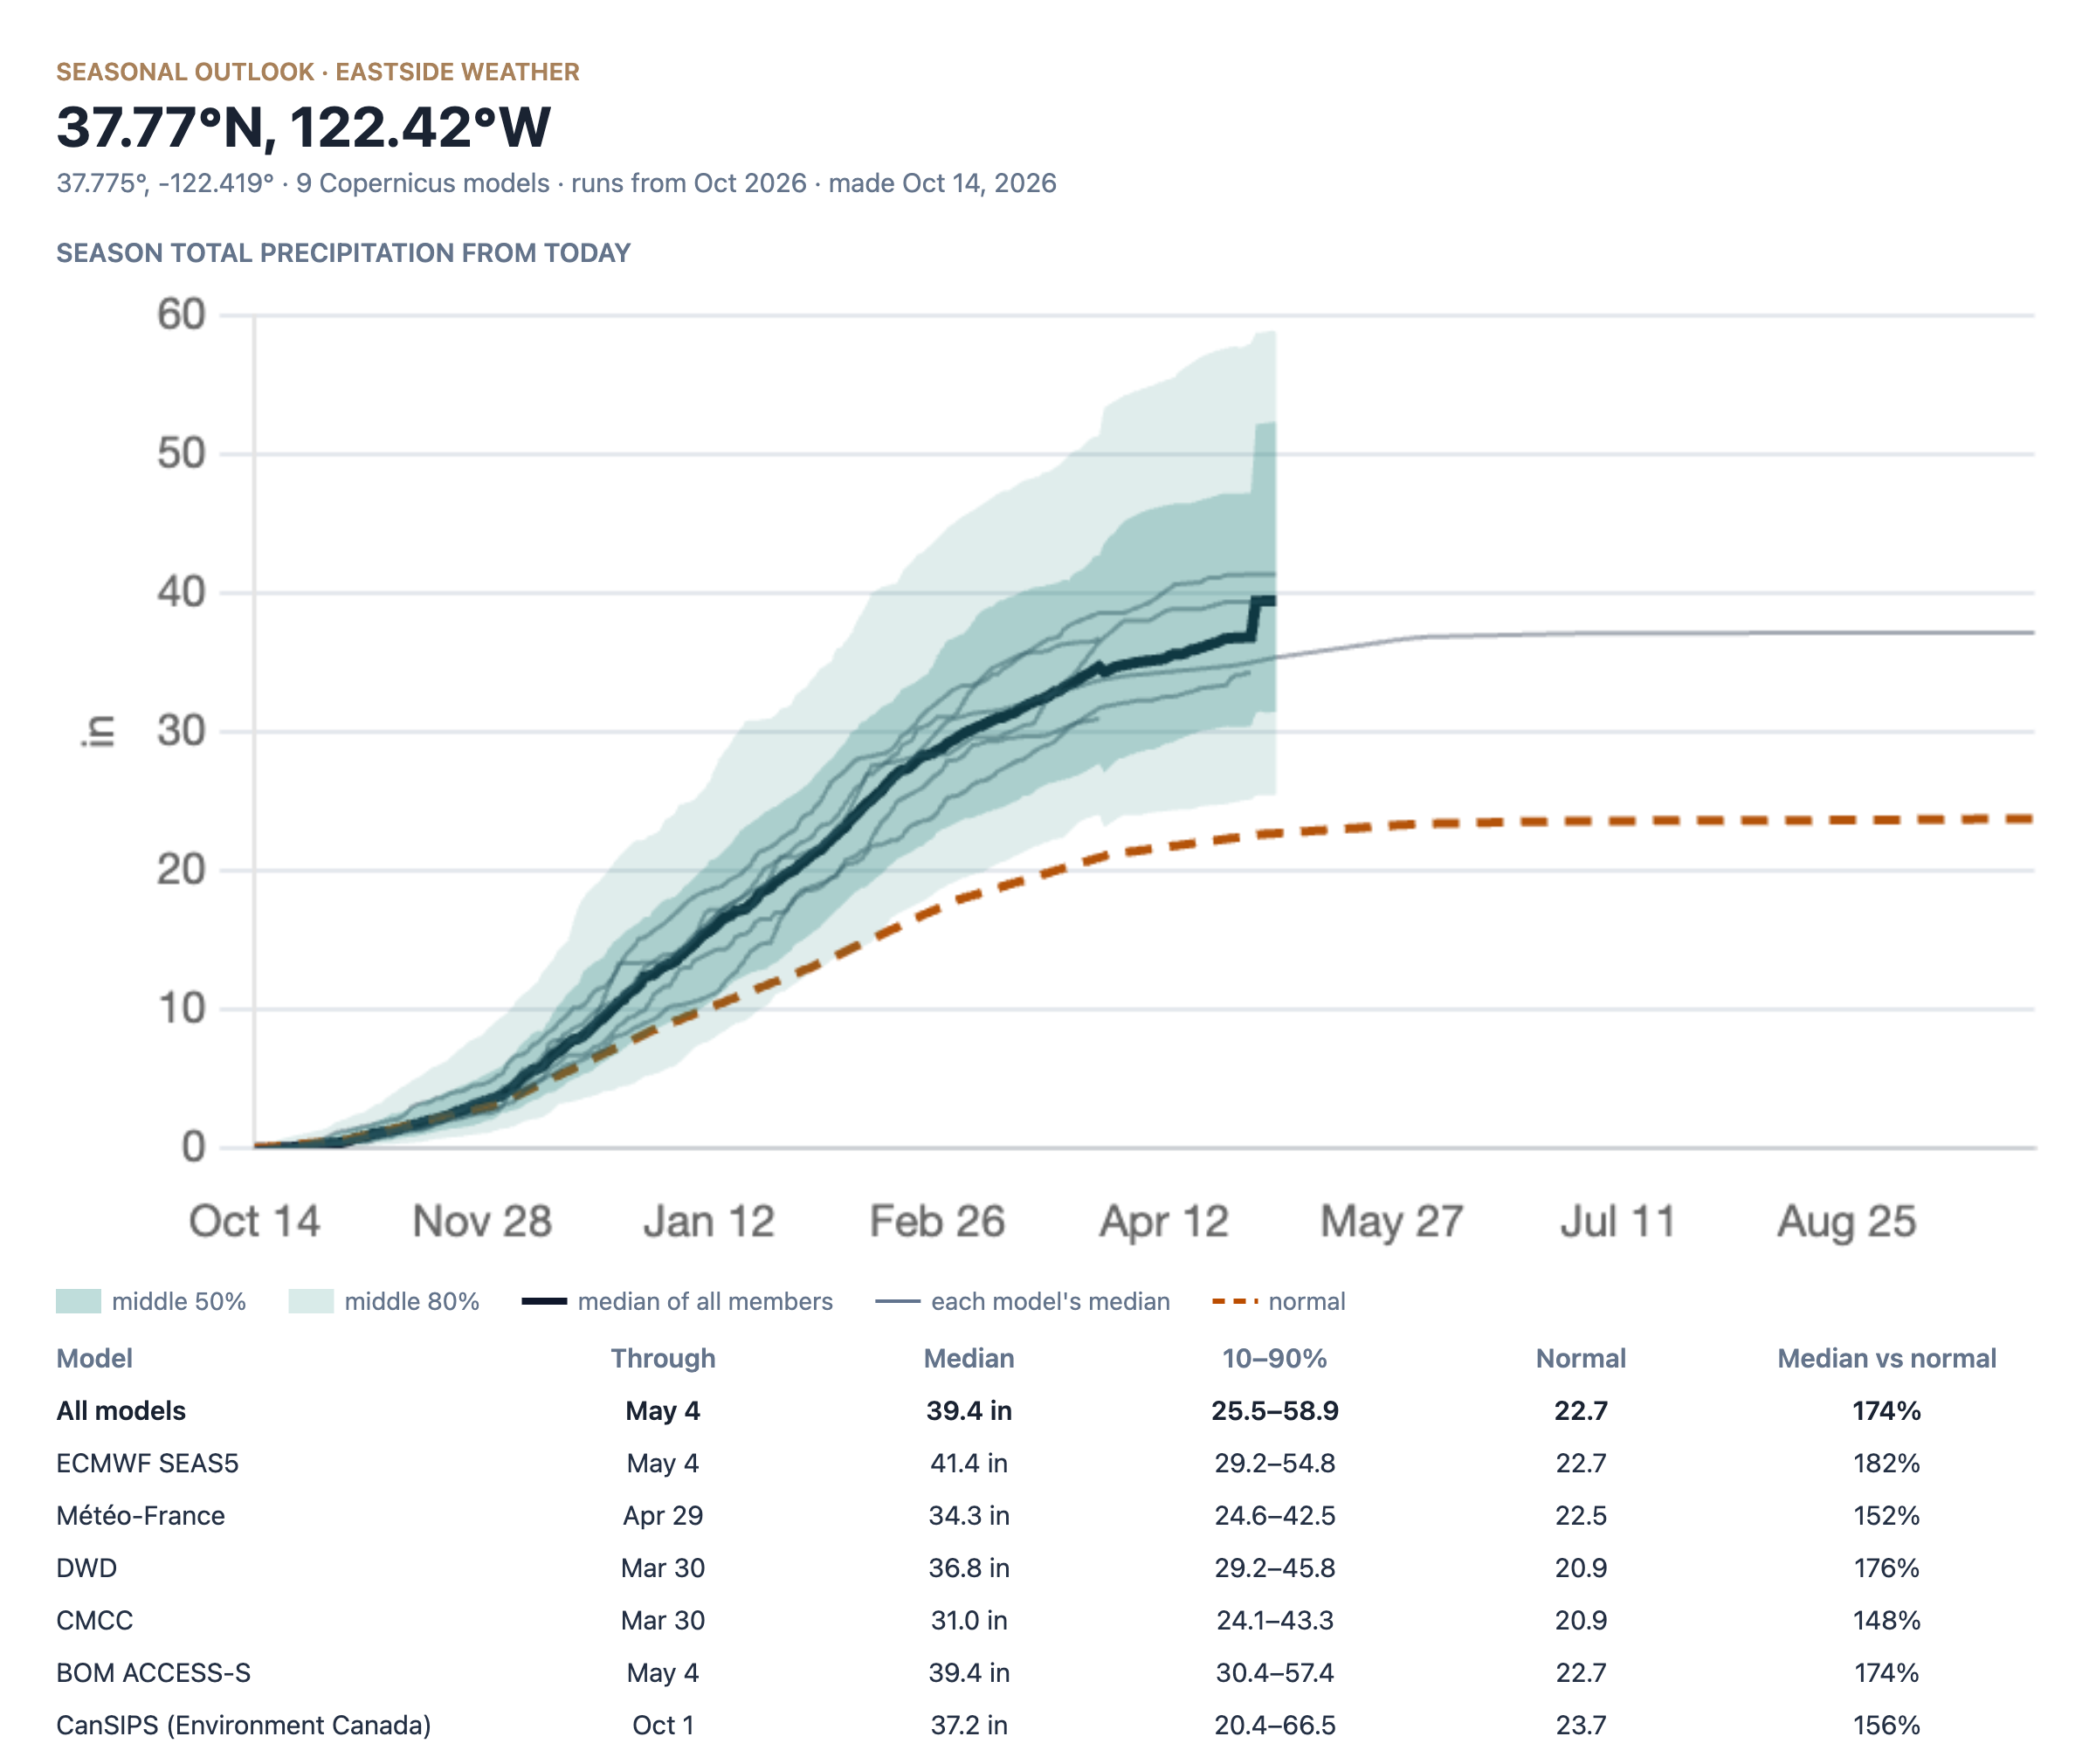
The median of all ensemble members comes in at about 39 inches through early May, while San Francisco has an average of 23" of rainfall. That is 174% of average, with the flagship ECMWF at about 182%, with every model in agreement of a significantly above average winter. Every model also shows January with a 70% to 95% chance of being wetter than normal in San Francisco.
This is straight up the most ridiculous agreement in a wet winter that I've ever seen in seasonal guidance. It's really hard to deny the coherence of this signal.
Seasonal models can and often do fall short individually. But some experts online believe that their particular weaknesses may actually mean they are underplaying the impact of this El Niño out west. Seasonal models tend to struggle with "zonal advective processes", meaning the movement of warm water along the equator by ocean currents and winds. This is the most important process in a strong El Niño, so it is possible these models are even underplaying the effect on California. With that being said, I'm not ready to forecast a wet winter in Mammoth just yet.
What Have Strong El Niños Meant for Mammoth?
Using the Snowfall Explorer on this site, here is every Mammoth Mountain season since 1969-70 that was a strong El Niño over the winter:
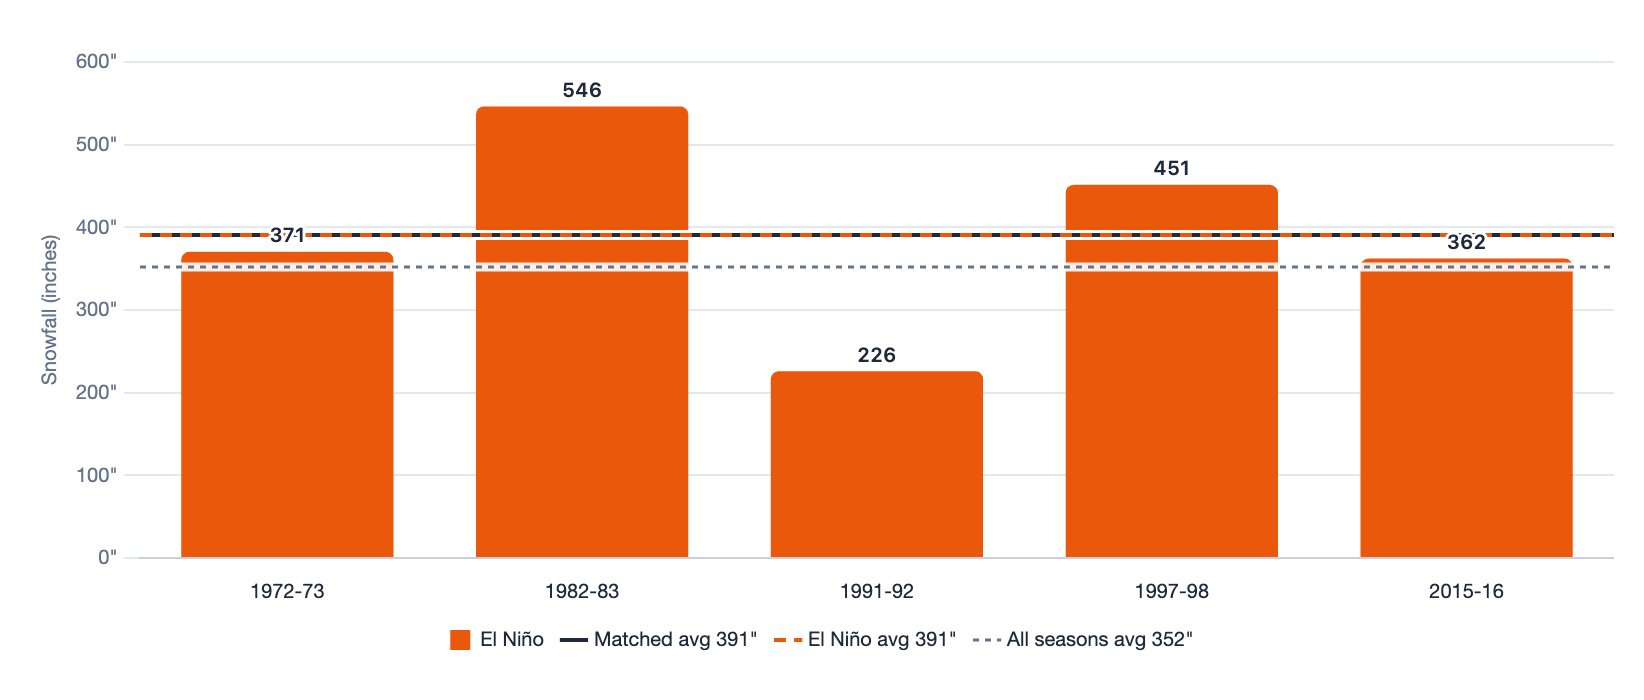
Those five strong El Niño winters averaged about 391 inches at Mammoth, compared with 352 inches across all seasons, or about 111% of average. Four of the five came in above average. However, not all of our snowiest years were El Niño, and not all strong El Niños end up above average... El Niño tilts the odds rather than promises snow.
The Other Players: QBO, PDO and the Polar Vortex
While El Niño is rightfully receiving the bulk of the attention this year, there are always other factors at play. Below, I briefly discuss them:
QBO. The Quasi-Biennial Oscillation, the slowly reversing winds high above the equator, has turned westerly at 50 mb. All else being equal, a westerly QBO tends to favor a more zonal storm track, which generally means wetter conditions for the West.
Taking a look at the observed precipitation in both E/W QBO winters, we can see that WQBO winters favor slightly above average precipitation, while EQBO winters favor slightly below average precipitation.
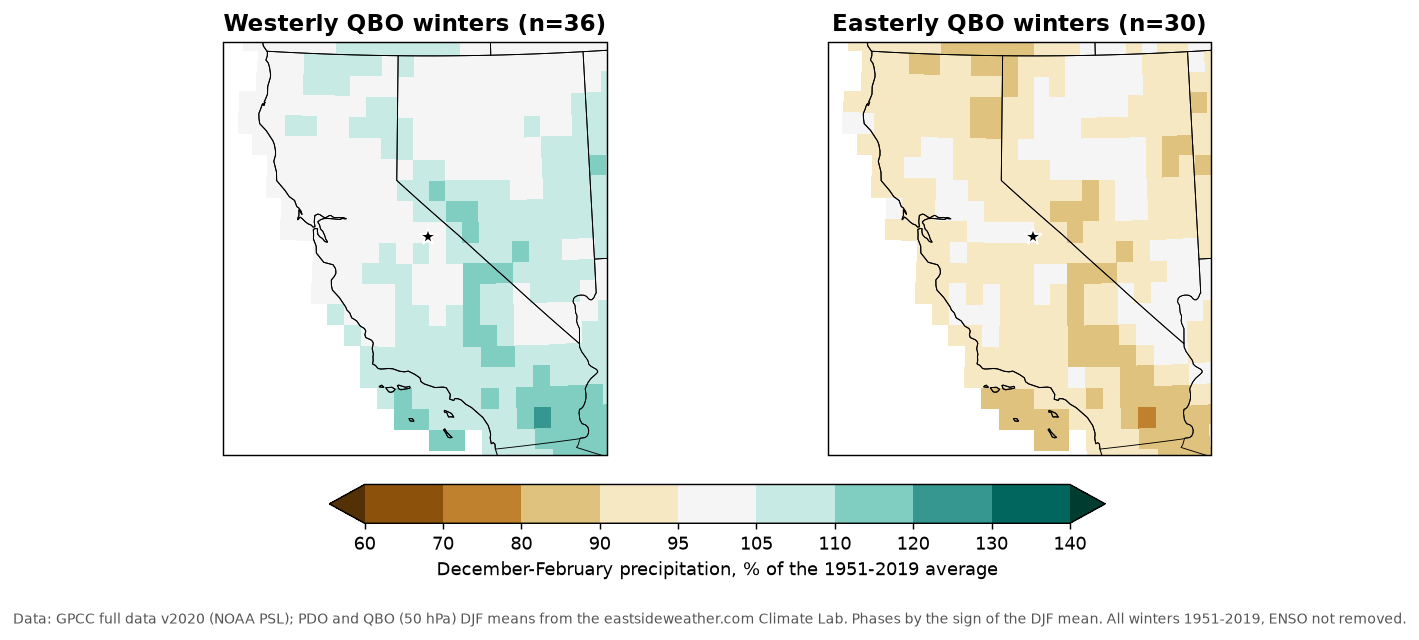
The Snowfall Explorer on this site tells a similar story for Mammoth Mountain: westerly QBO seasons have averaged about 374 inches of snow, against about 327 inches in easterly QBO seasons. The most important part of the QBO is how it modulates MJO response at mid-latitudes.
Our Climate Lab composites show just how much. The same MJO phase can flip from wet to dry depending on the QBO. In phase 6, easterly QBO winters run wet across California while westerly QBO winters run dry, and phase 7 flips the other way:
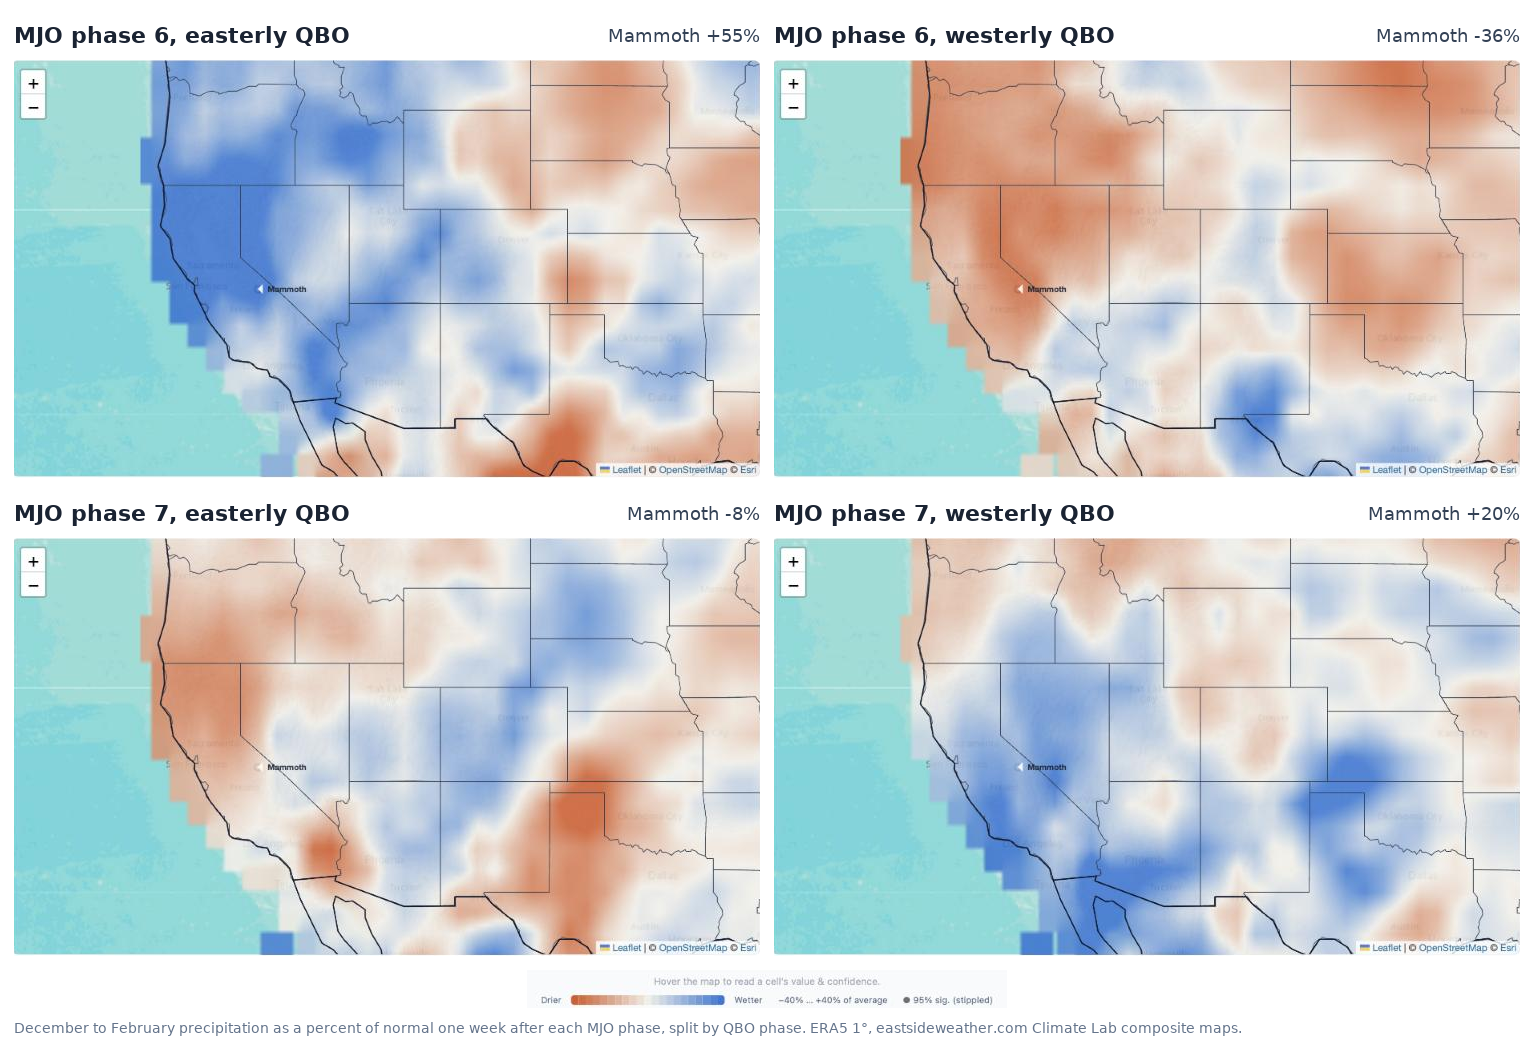
With the QBO now westerly, phase 7 looks like the friendlier one for us this winter.
PDO. The Pacific Decadal Oscillation describes a long-lived pattern of sea surface temperatures in the North Pacific. In its positive (warm) phase, the waters along the North American coast run warm and the central North Pacific runs cool, and the negative (cool) phase is the reverse:
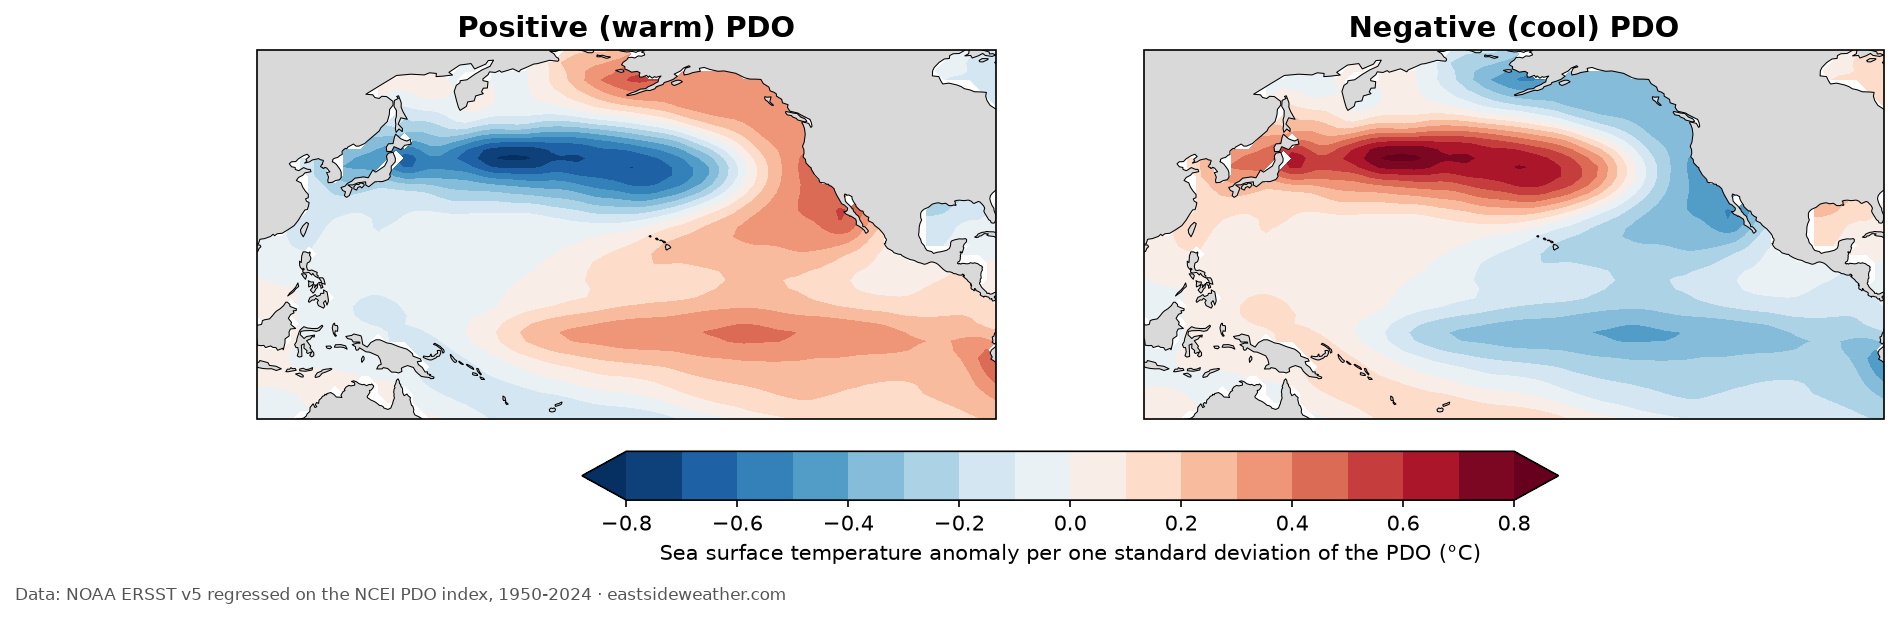
The PDO has been strongly negative for years, which is often thought to favor drier winters in California. But it appears to be weakening, possibly in response to the El Niño background state. It has gone from about -2.2 in July to about -1.6 in September, compared with -2.3 last September and -3.6 the year before. And the realtime SST observations show this trend continuing throughout October. In my opinion the PDO will be a much weaker seasonal forcing than an El Niño of this strength, if the -PDO even lasts until winter.
In fact, the PDO on its own has had a surprisingly small effect on California winters. Since 1951, December through February precipitation has averaged about 103% of normal in positive PDO winters and about 97% in negative PDO winters, and some of that difference is really El Niño, since positive PDO winters lean toward El Niño years:
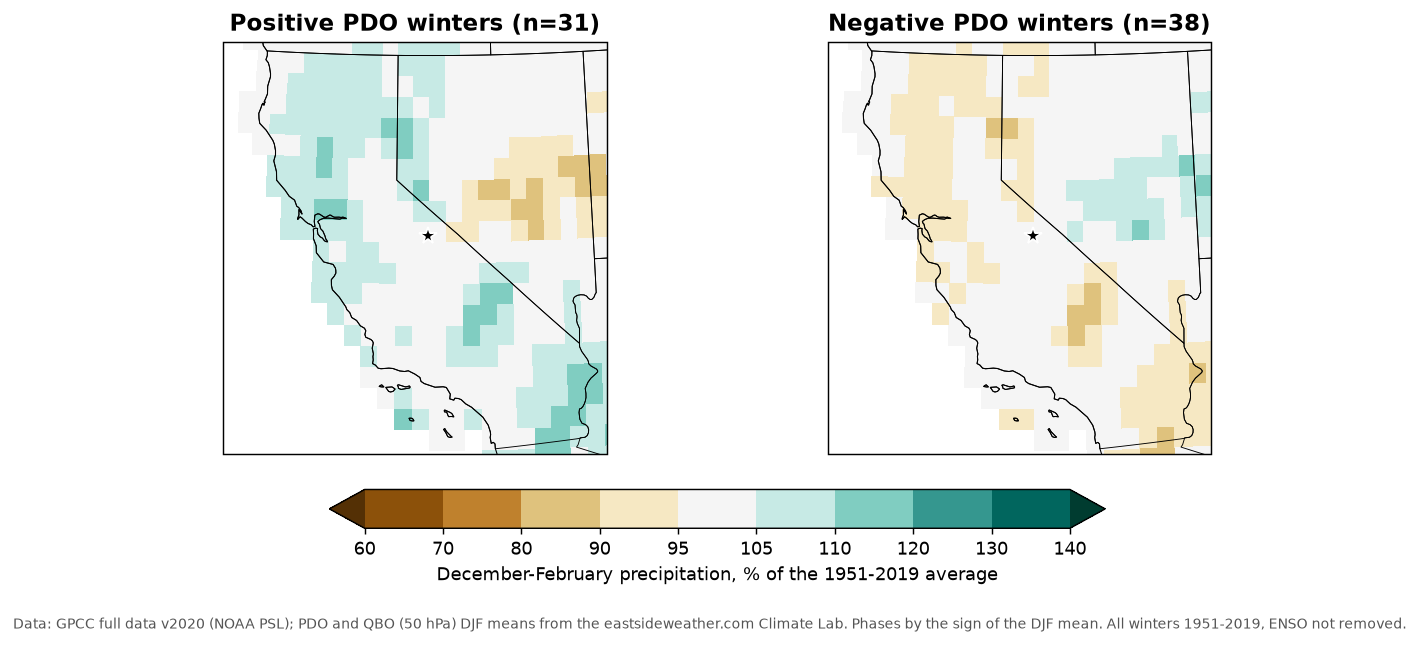
At Mammoth, the Snowfall Explorer shows almost no difference at all: about 349 inches in warm PDO seasons and about 355 inches in cool PDO seasons.
The polar vortex. This is the biggest factor that I expect to be an actual wildcard this winter. Judah Cohen, who writes one of my favorite blogs on the polar vortex, expects a stretched polar vortex in early November. When the polar vortex enters a stretched configuration, it tends to favor a ridge out west with troughing out east. Judah has been hinting that a weaker than average polar vortex may be the story this winter...
Here is a good example of what a stretched polar vortex looks like, from a NOAA study of the cold outbreaks in January 2025. The contours show the stretched vortex in the lower stratosphere, and the colors show the 500 mb pattern below it, with a big ridge over the West and a deep trough over the East. This is the canonical stretched PV look.
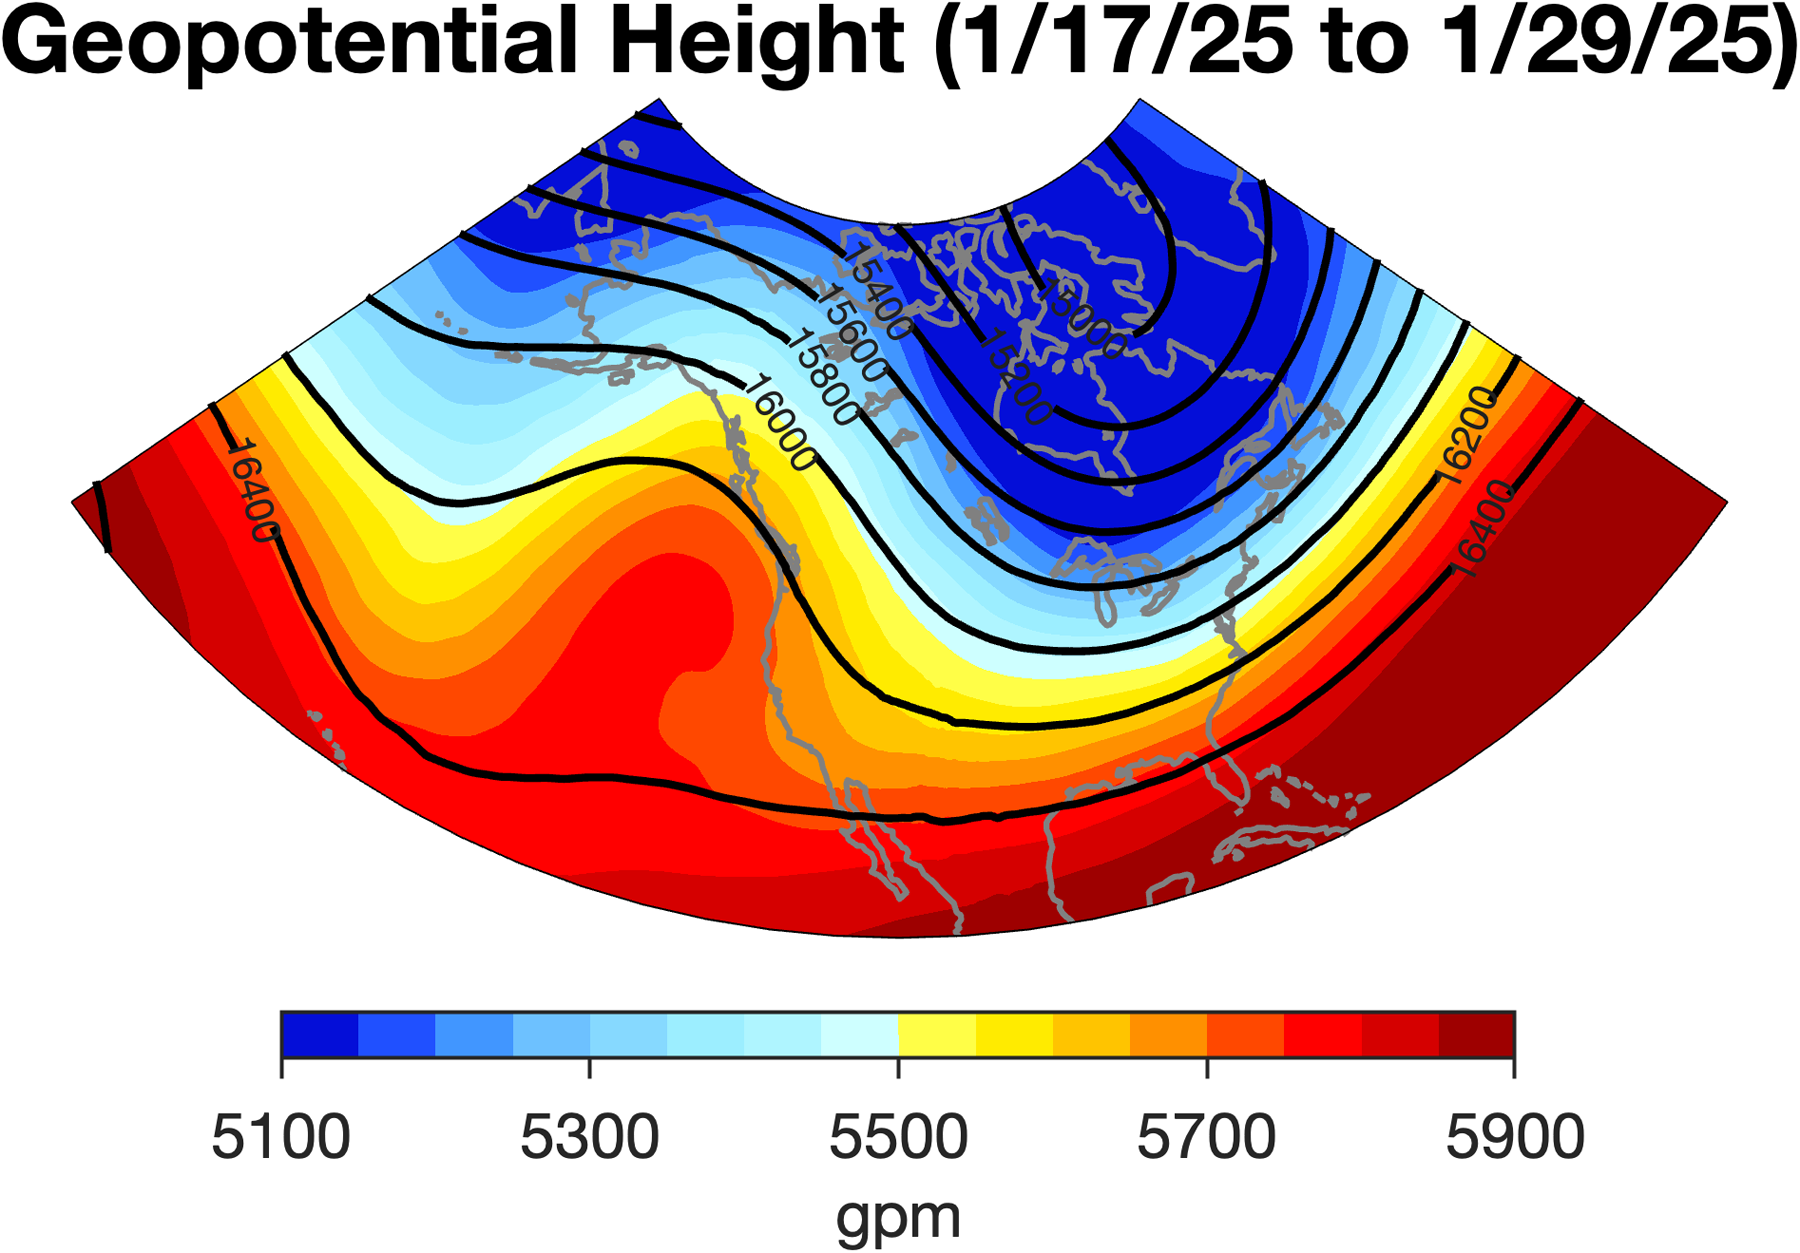
Figure from Overland, J., Chandra, V., Kim, B. M., Wang, M., Ku, H., & Hanna, E. (2025). A stretched Polar Vortex and North American and Eastern Asian Cold-Air Events during January/February 2025. PLOS Climate, 4(8), e0000679. https://doi.org/10.1371/journal.pclm.0000679 (CC0 public domain).
A stretched polar vortex can interfere with the El Niño background state by setting up a stationary, amplified north to south flow. But it is not necessarily a death sentence for California. A strong subtropical jet might be able to undercut a West Coast ridge and still bring storms in from the southwest. This is something I will be watching closely through November, and I'll be reading the experts' opinions closely to see what we can expect this winter.
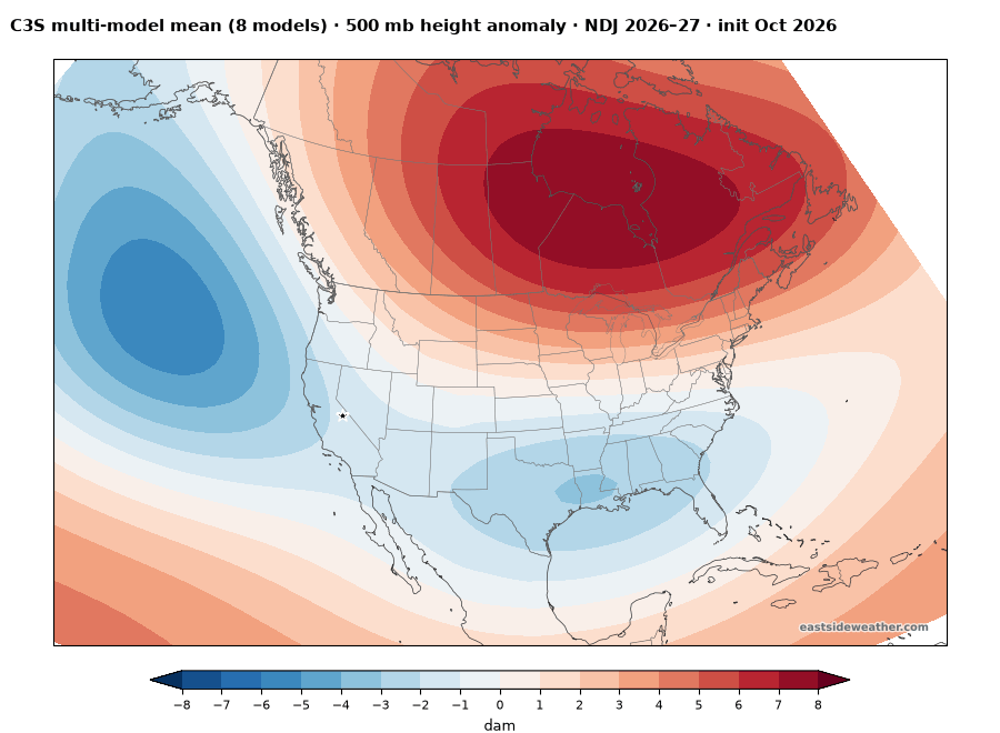
Interestingly, the seasonal models don't show much of a West Coast ridge for the early winter. Their multi-model mean for November through January has a deep low in the Gulf of Alaska and lower heights across the southern tier of the country:
I'll be issuing a proper winter discussion in early November... Until then, pray for snow! As always!