Our Halloween Storm Is Here. 6-10" for Main Lodge! And More Active Weather Follows?
Overview
My friends...
Happy Halloween! Our storm has officially arrived. The first round of showers rolled in Thursday night, with the heaviest totals falling to the north of Mammoth, and scattered showers have continued across the region. Main Lodge is reporting 1" as of today. The main event arrives Saturday night, and will bring moderate snowfall totals across the Sierra, with the highest totals to the North and West of Mammoth.
The models have trended towards more precipitation, so here are the updated totals:
- Main Lodge: 6-10"
- Mammoth Summit and High Peaks: 8-14"
- Town of Mammoth Lakes: 3-6"
Longer range, the models continue to advertise a serious Gulf of Alaska troughing pattern, which could open the door to much wetter storms.
Storm timing and snow levels
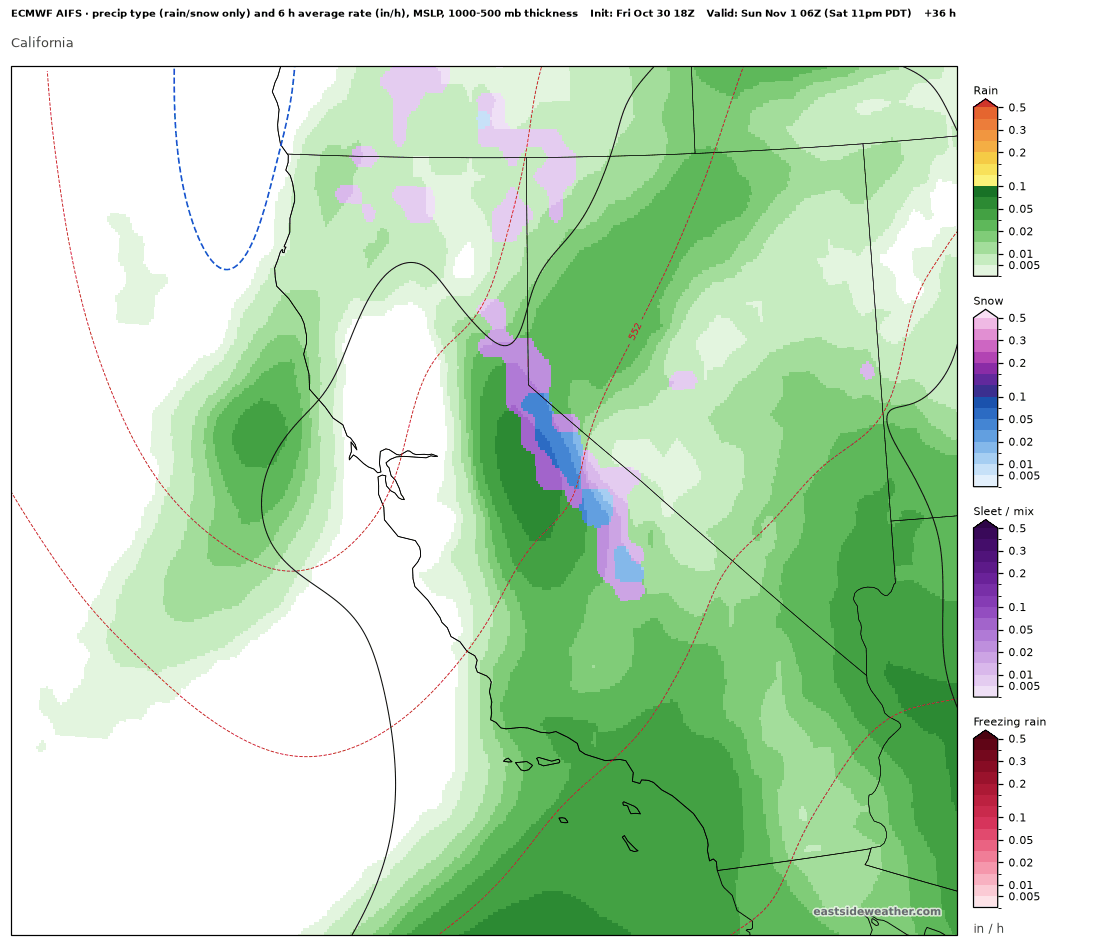
Scattered showers continue through Saturday, with snow levels fluctuating between around 7,500 to 8,500 feet during the day. On Saturday night, the heaviest snowfall arrives, alongside the colder air. Town turns to all snow after 8pm. Snow levels keep crashing to about 5,500 to 6,000 feet by early Sunday. Snow tapers off Sunday morning, and we clear out Sunday night with a chilly low in the 20s.
Here is the Euro AI model (AIFS) at 11 PM Saturday night...
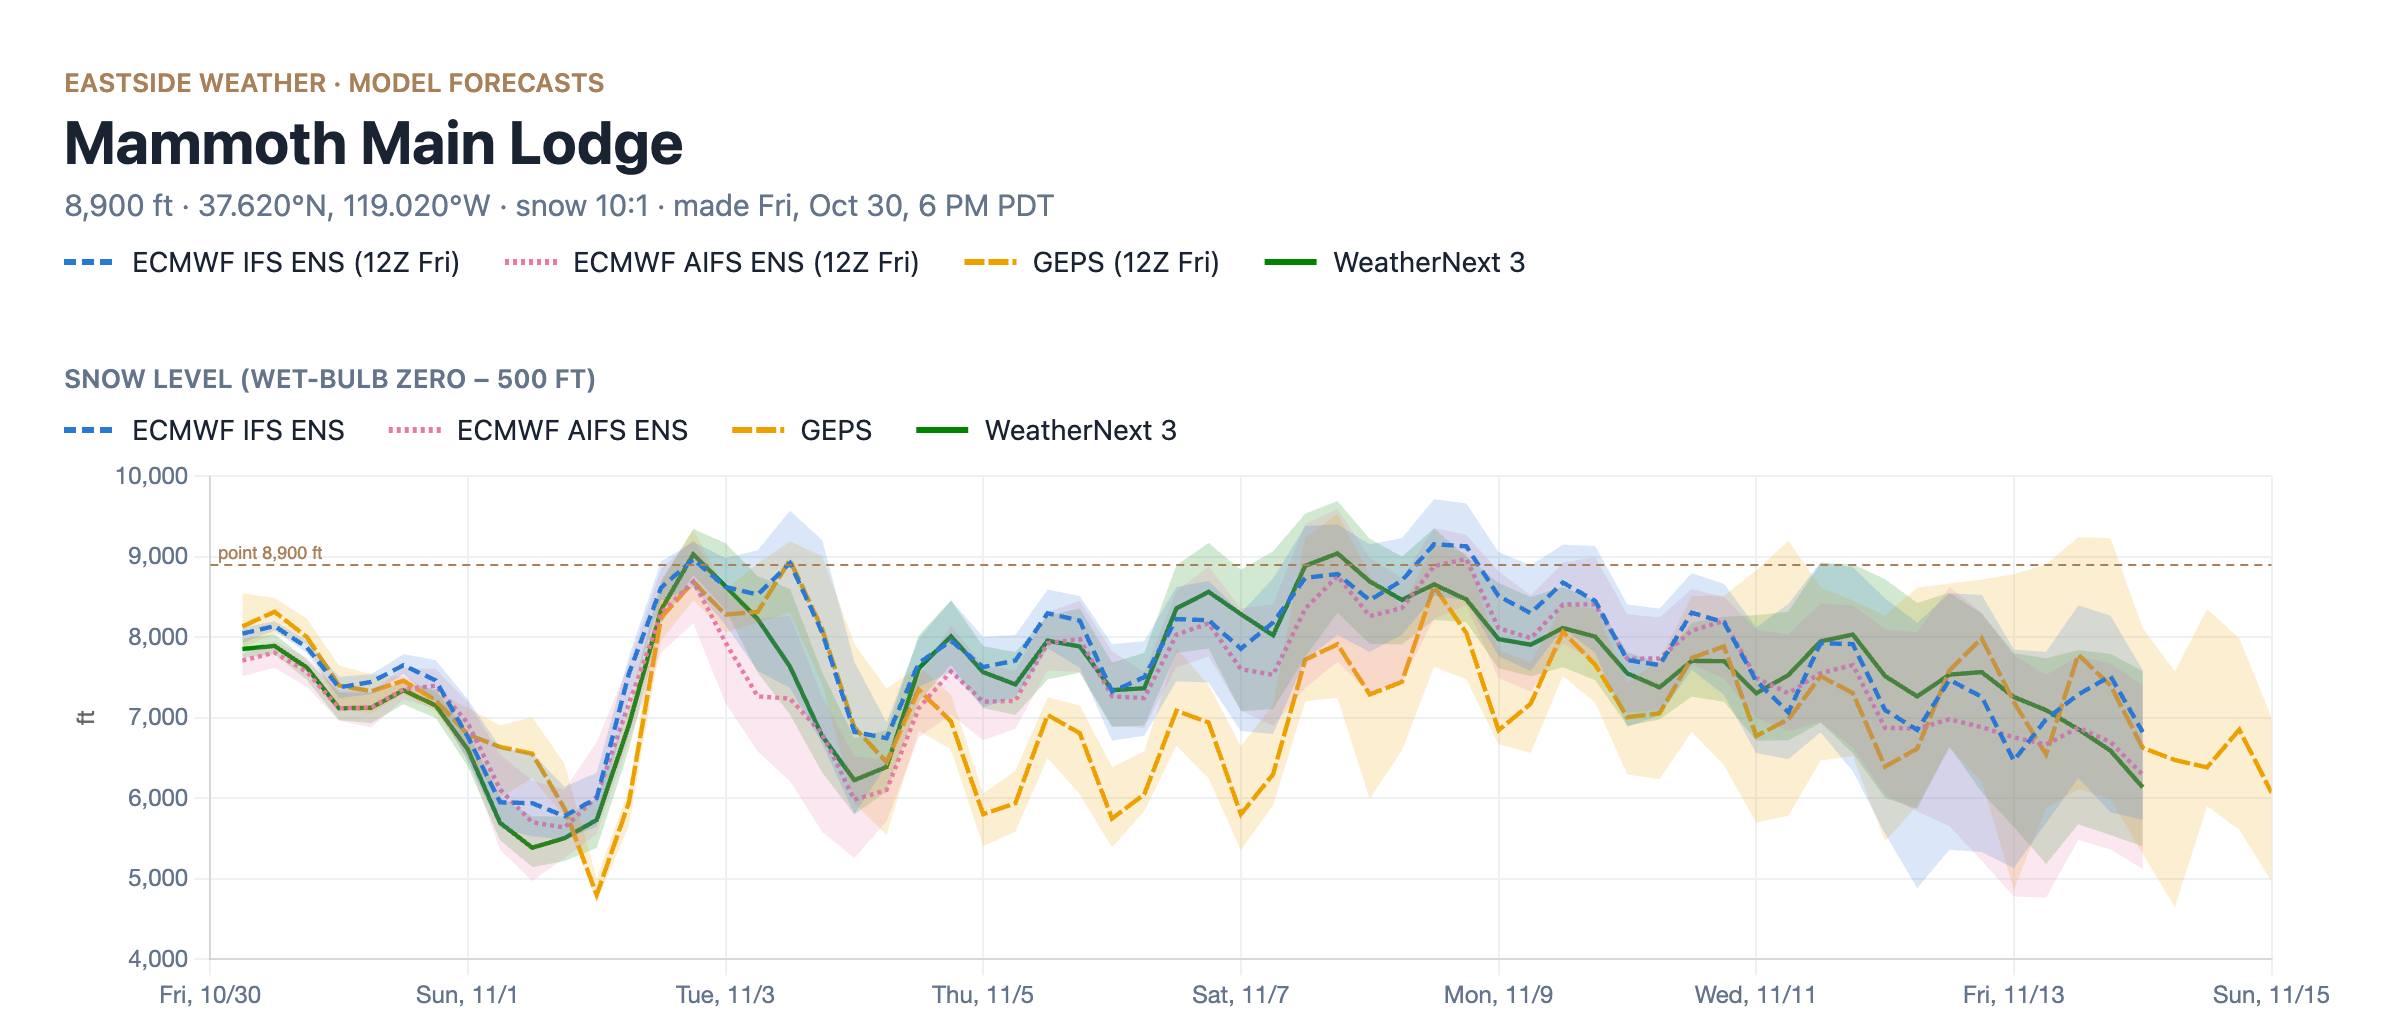
How much?
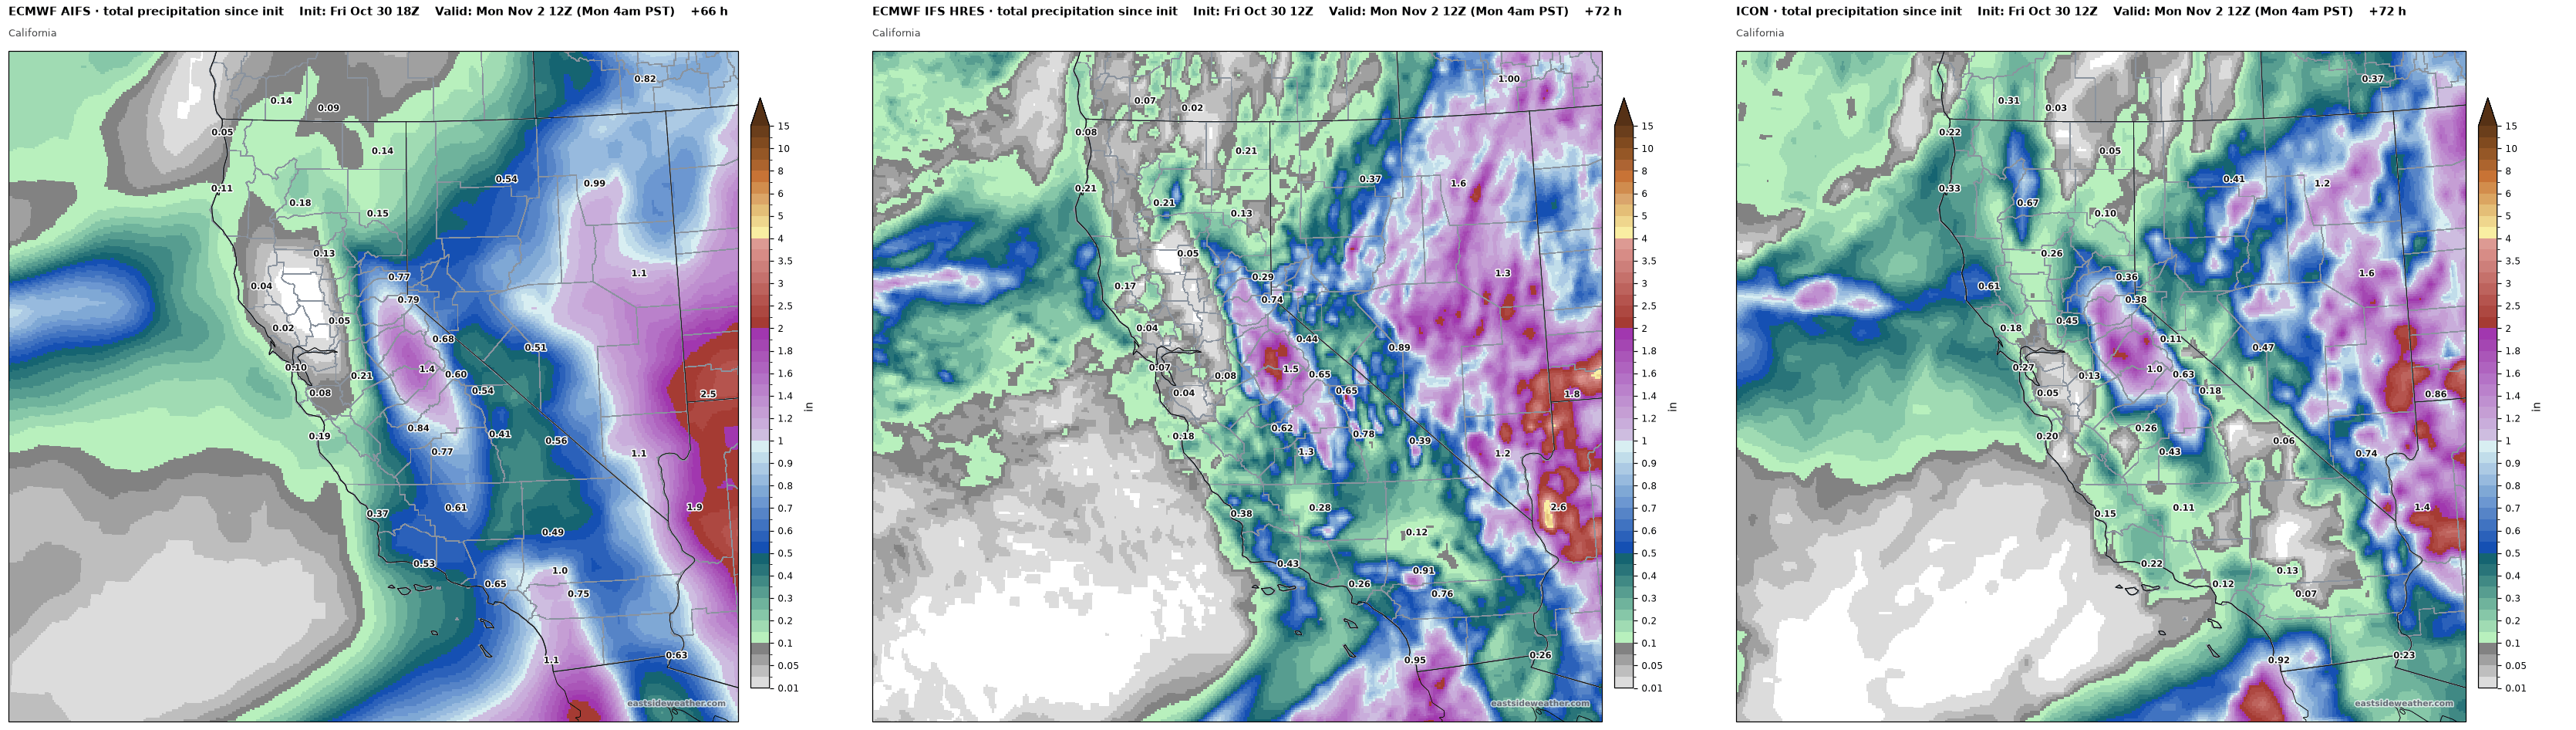
Here is the total precipitation through Monday morning from the Euro AI model (AIFS), the Euro (IFS HRES), and the ICON. All three put the heaviest totals over the central Sierra west of the crest, at around 1-1.5". The range shown across models is still about 0.7" to 1.3" of liquid.
Here is the snowfall at Main Lodge from all of the ensembles through Sunday. The Euro (IFS ENS) is the most aggressive at around 11", the Euro AI model (AIFS ENS) and WeatherNext 3 sit right around 6-7". The heaviest totals will still be to the west and north of Mammoth, but the southwest flow with this system favors us orographically.
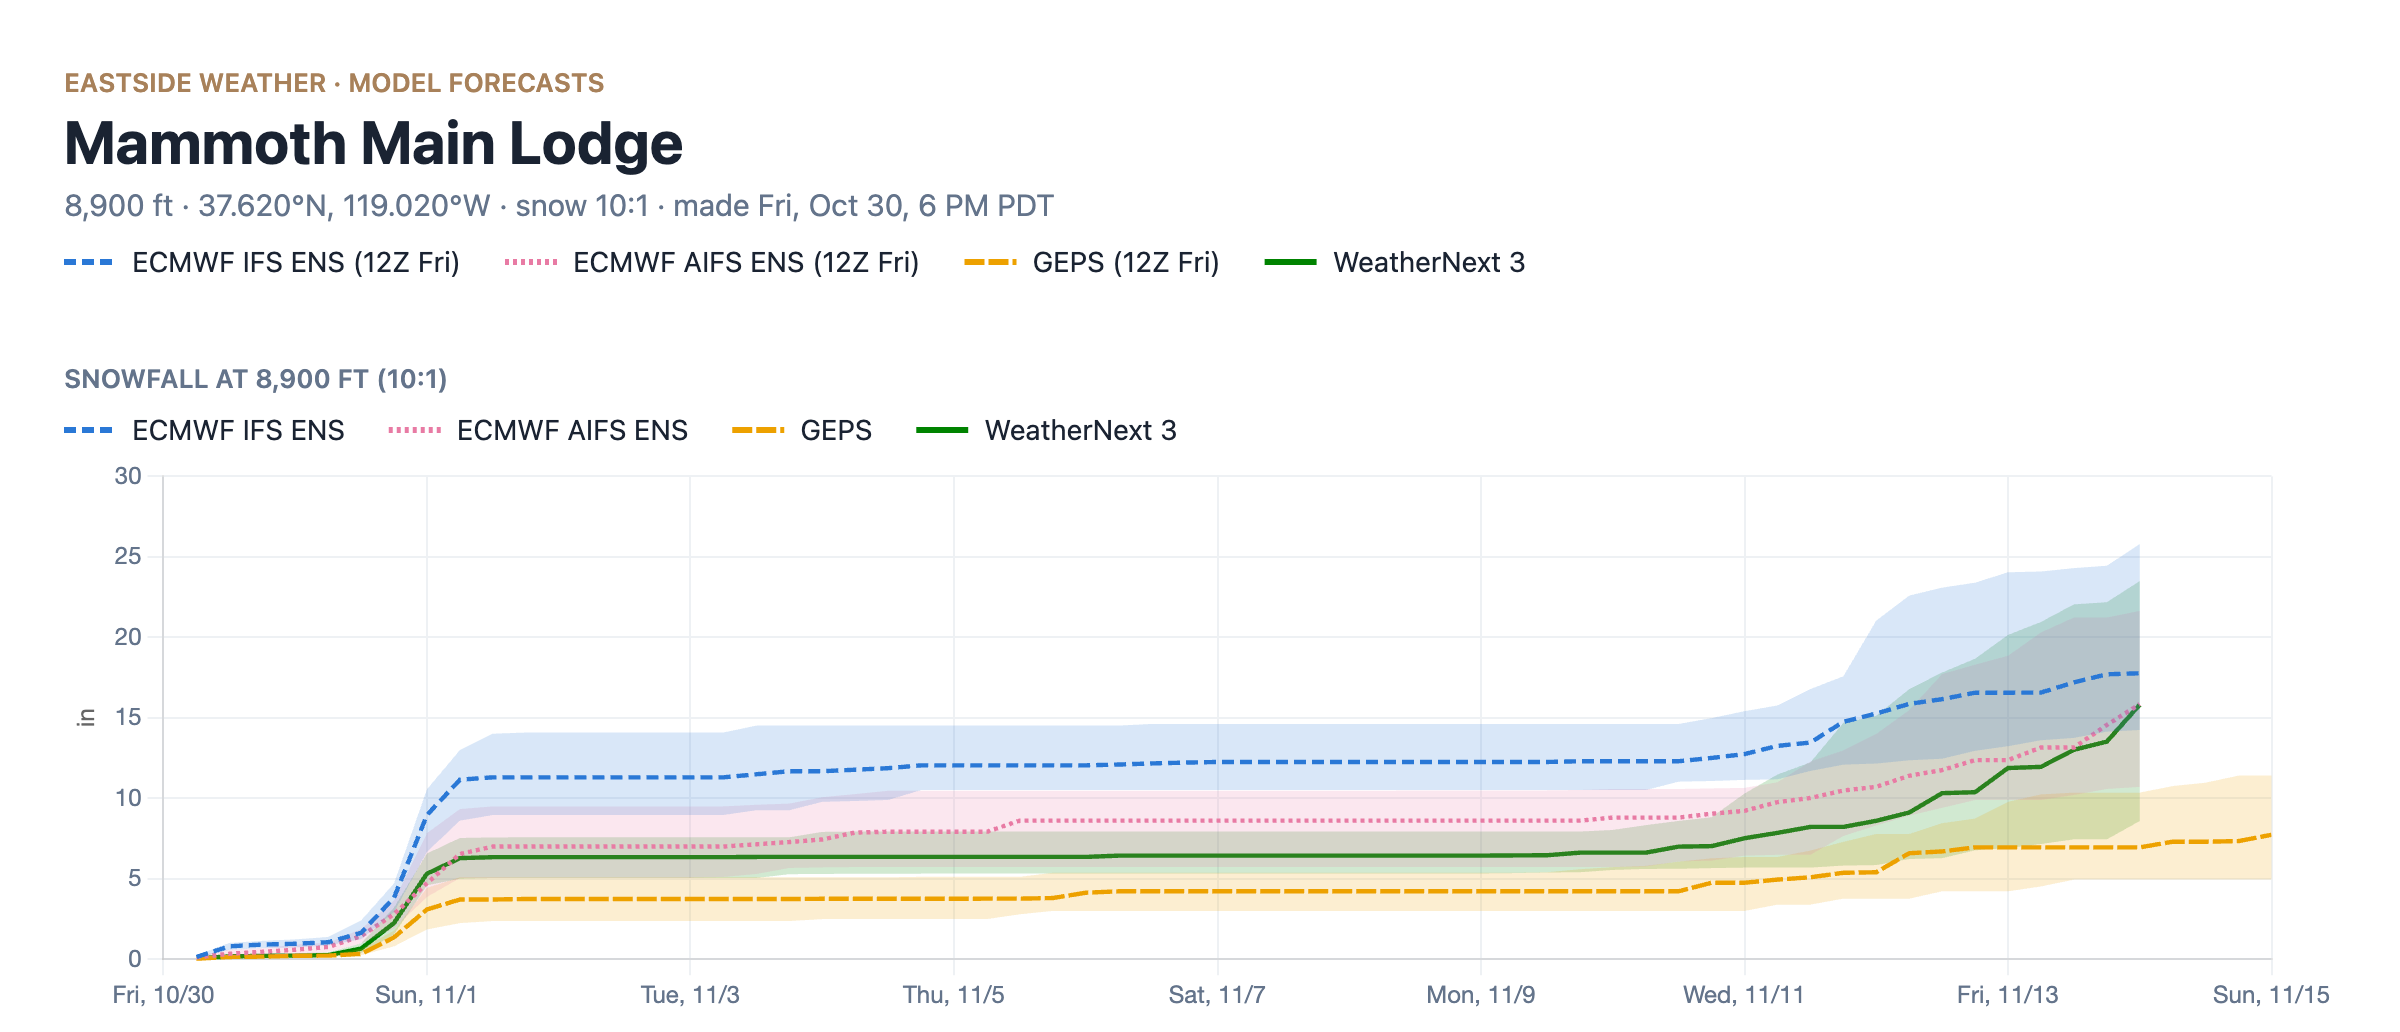
For storm totals thru Sunday, I'm thinking 6-10" at Main Lodge, 8-14" at the summit, and 3-6" in the town of Mammoth Lakes and similar elevations on the Eastside.
Monday briefly clears up as more weak storms may clip us next week, but nothing really convincing or high confidence yet.
A Gulf of Alaska trough nudging closer
In my last post, I talked about a trough setting up in the Gulf of Alaska, favoring the Pacific Northwest at first before nudging south later in the month. This has been shown in seasonal guidance, long-range subseasonal models, and now medium range guidance consistently for some time.
Here is WeatherNext 3 on Tuesday, November 10 (left) versus Saturday, November 14 (right). The trough nudges much closer to California.
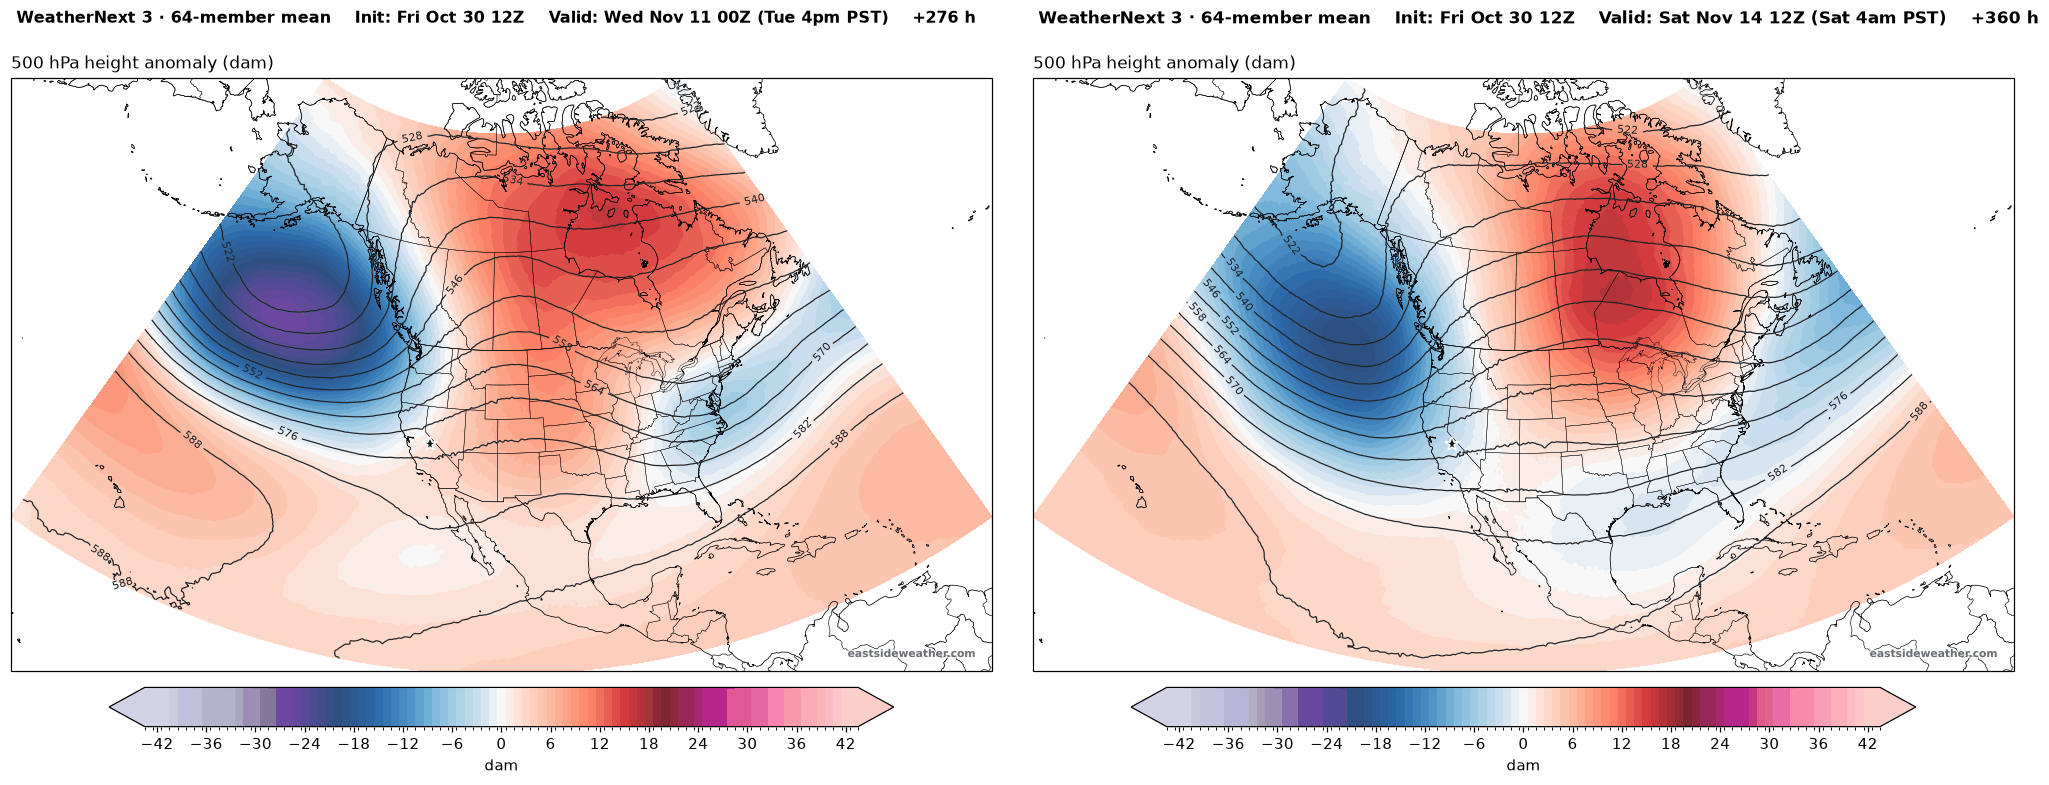
This is a canonical El Niño look. A deep, persistent trough in the Gulf of Alaska pumps up the jet stream across the Pacific and steers storms into the West Coast. This is a great look for getting a much wetter storm, and would coincide right around opening weekend!
This has support from all the other ensembles as well:
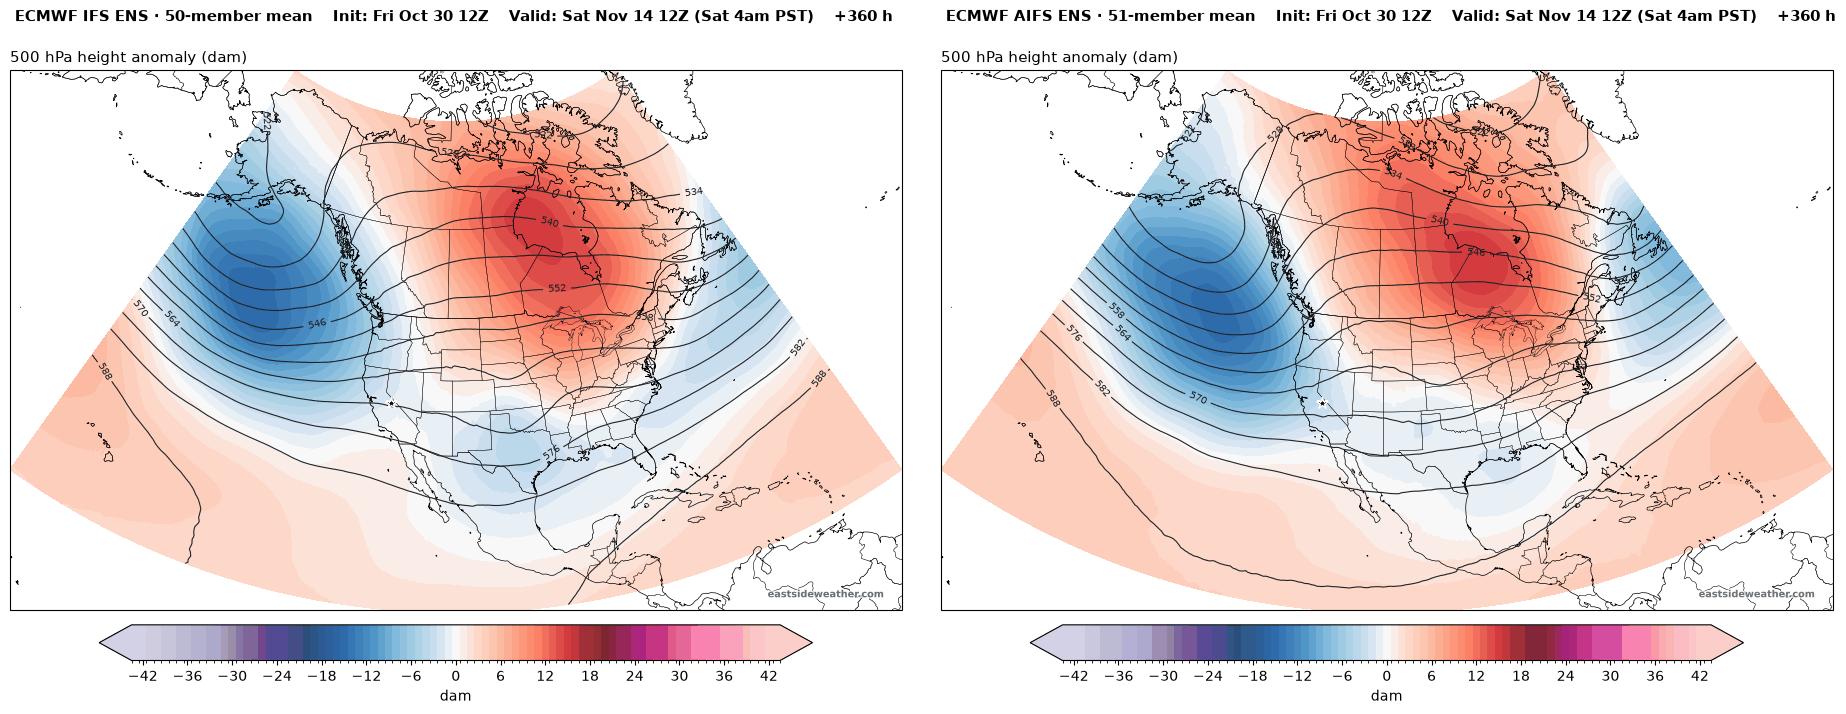
A wet signal mid month
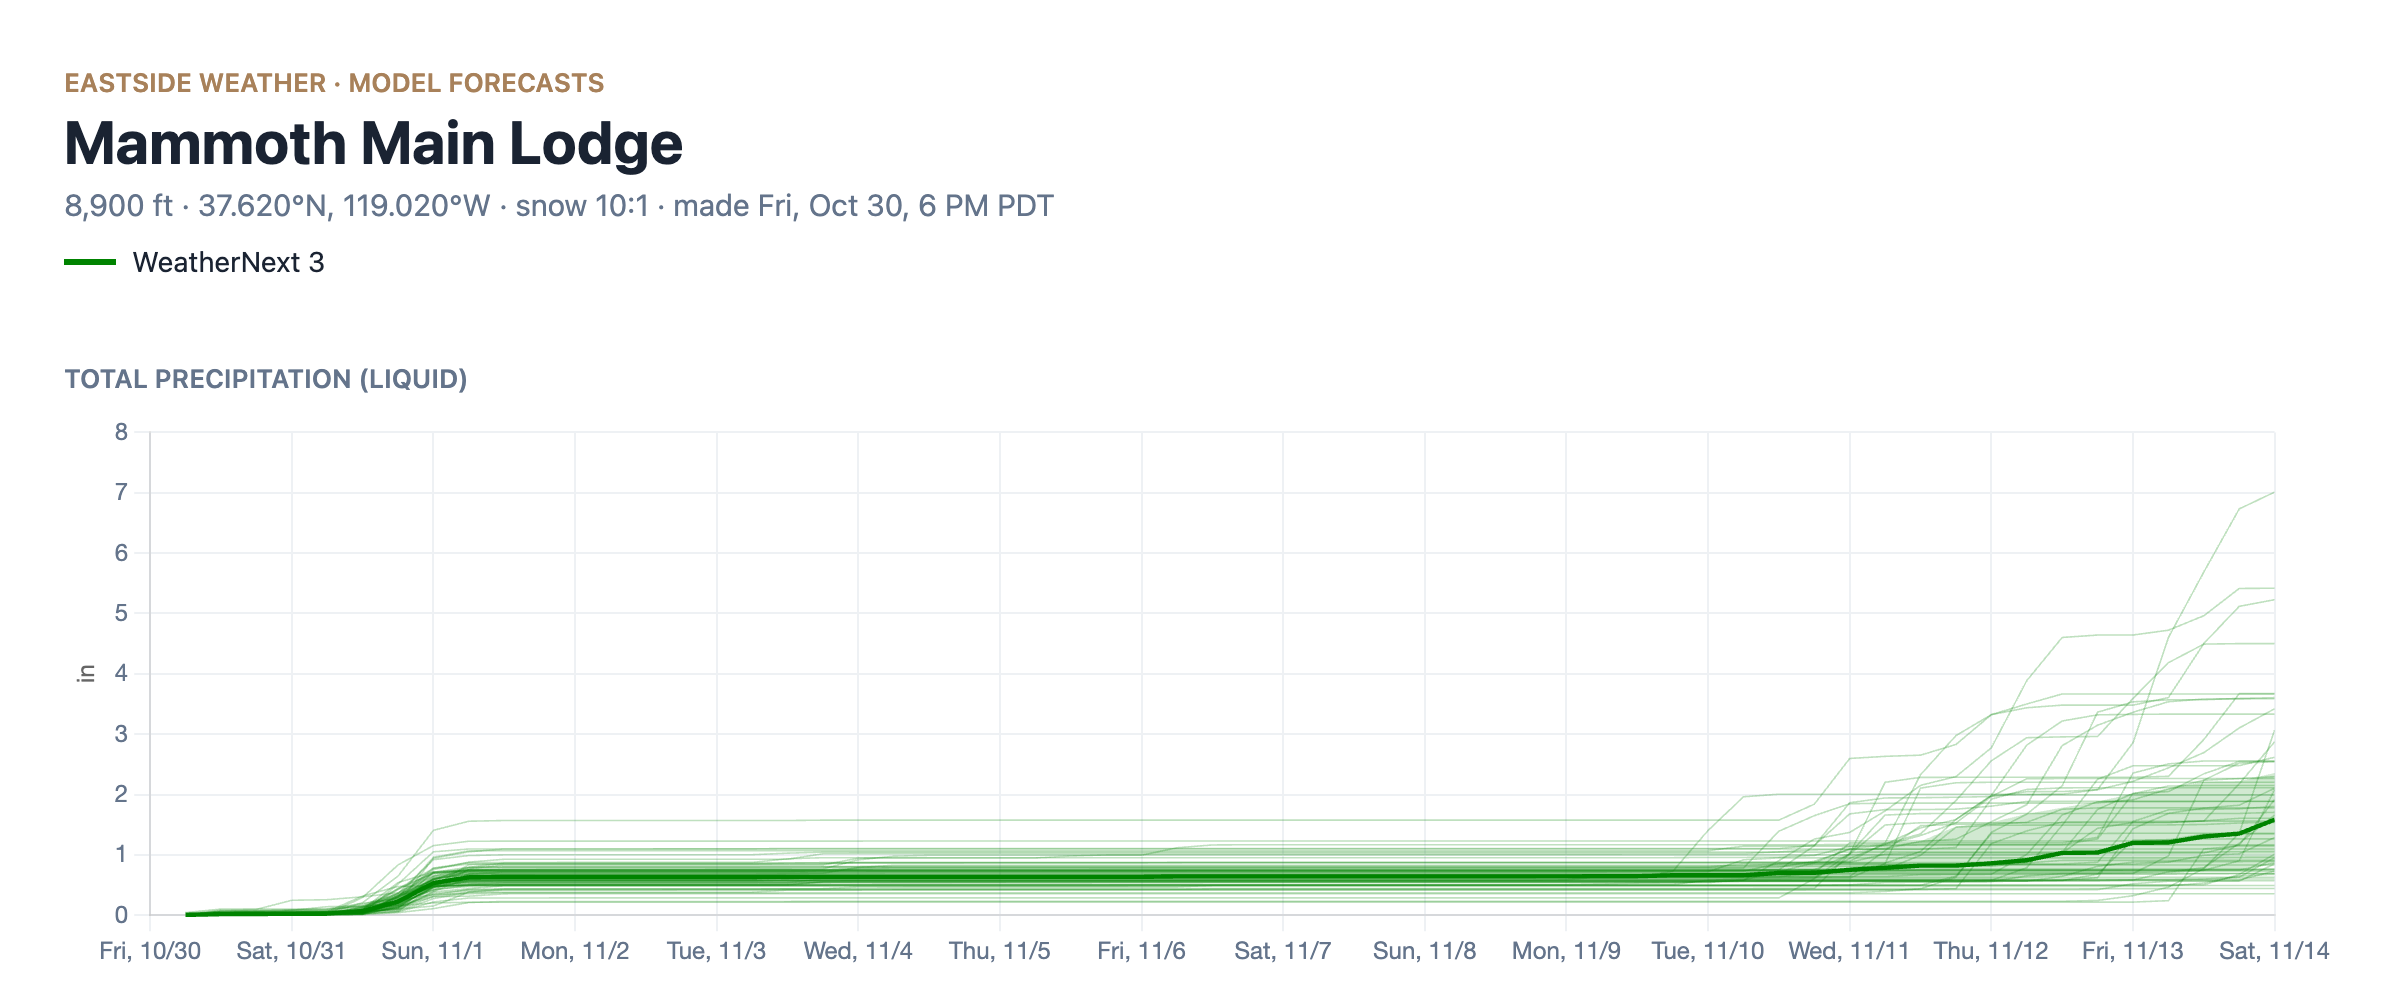
Ensemble members now start to show a significant uptick in precipitation amounts for that time:
All ensembles agree:
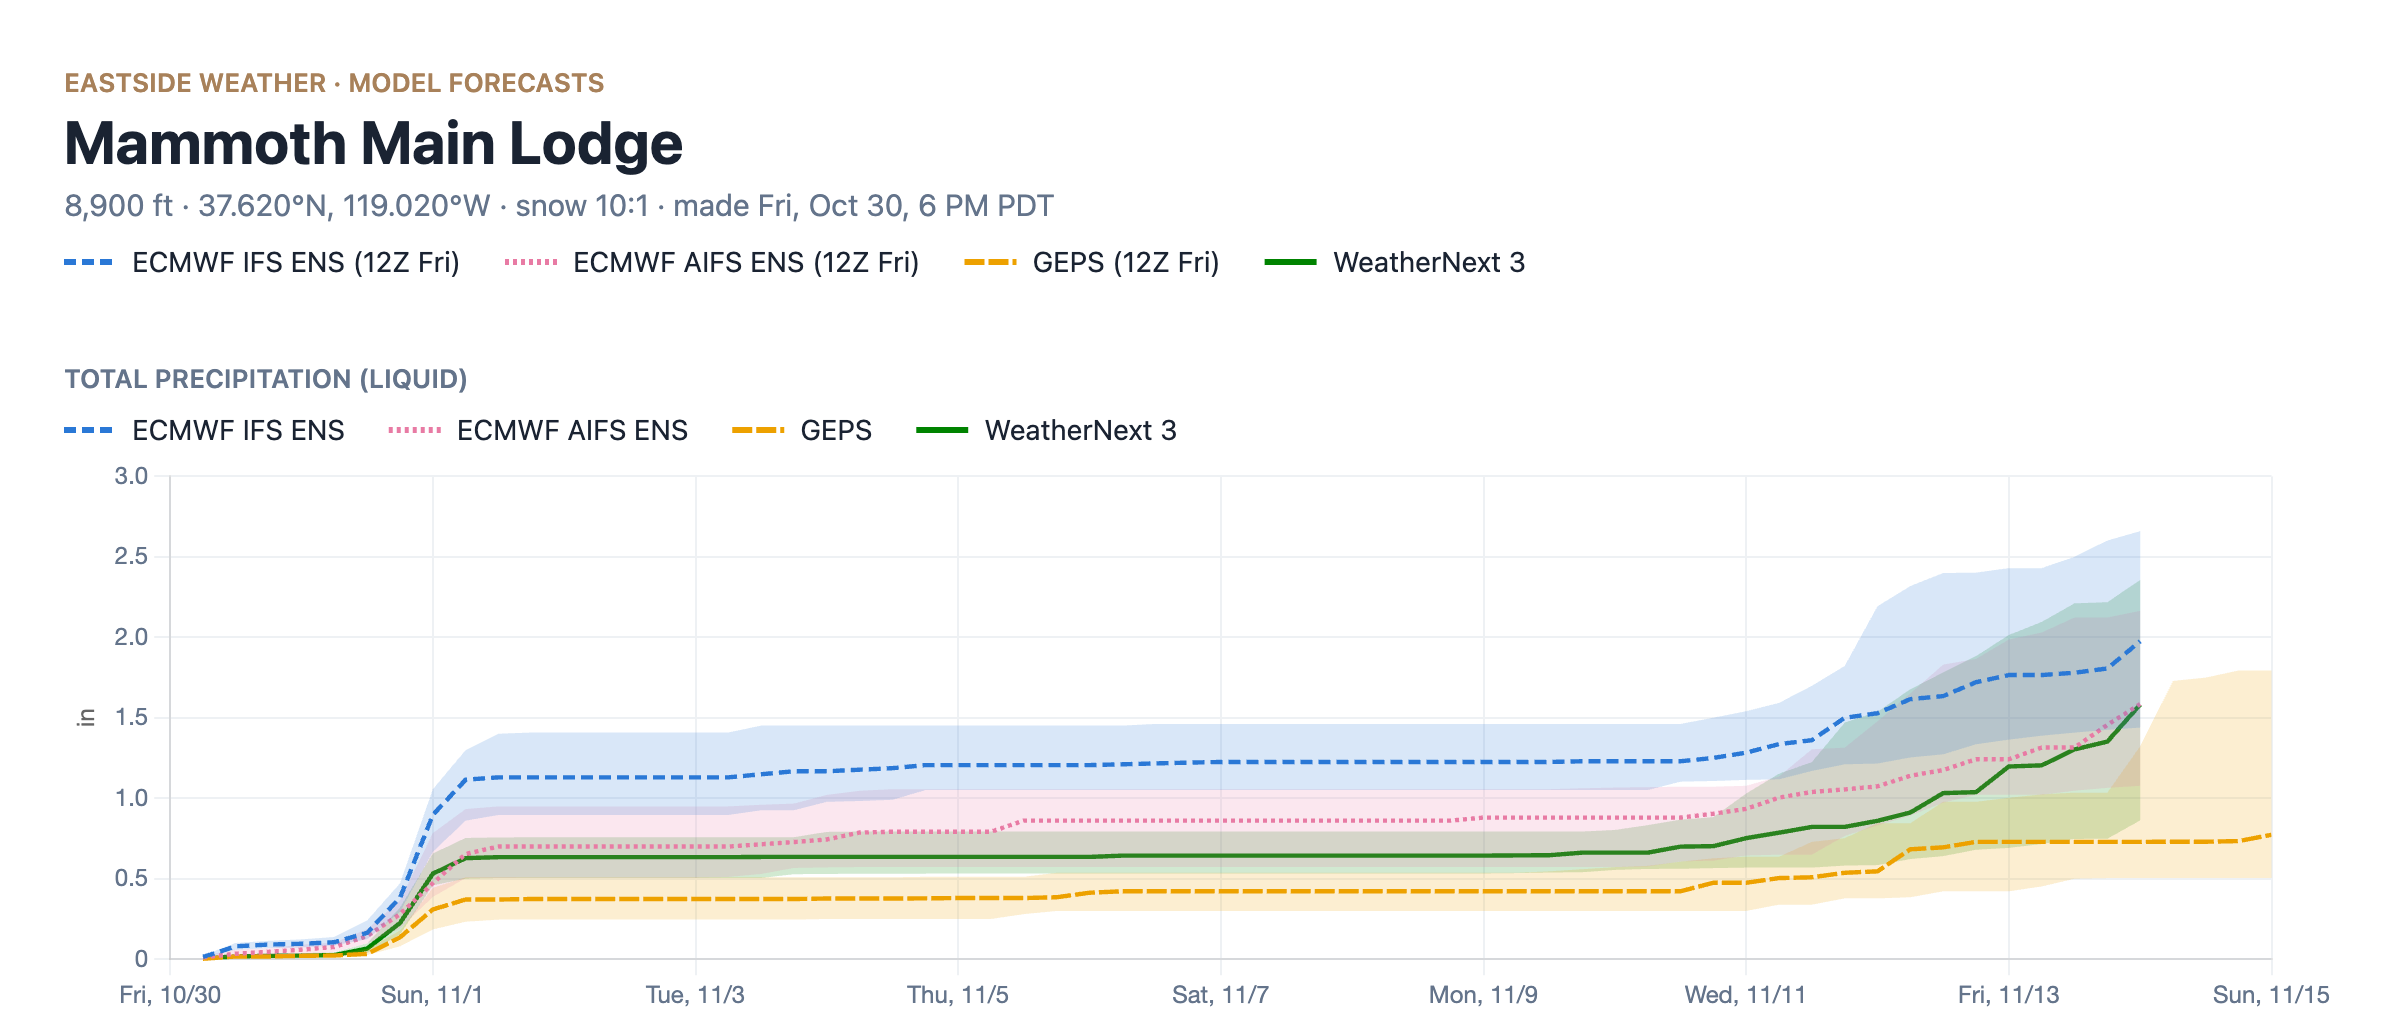
WeatherNext 3: © 2024-6 Google LLC, whose machine learning models were used to create the experimental data made available under the following licence terms https://storage.googleapis.com/weathernext-public/terms-of-use.pdf. This data is intended for experimental modelling only and is not intended, validated, or approved for real world use.
This is still two weeks out, but bears watching, and is also supported by both El Niño, and the MJO and +EAMT teleconnections, discussed below:
Why I think El Niño shows up early
El Niño is likely to show up earlier than "usual" this year, if the word usual can even be used at all...
The chart below shows the eastern edge of the Indo-Pacific Warm Pool (IPWP) in longitude, the big pool of warm water that drives thunderstorms across the tropical Pacific. In a normal year, it sits around 155-160°E. This year, it has pushed all the way out past 165°W, by far record for this time of year.
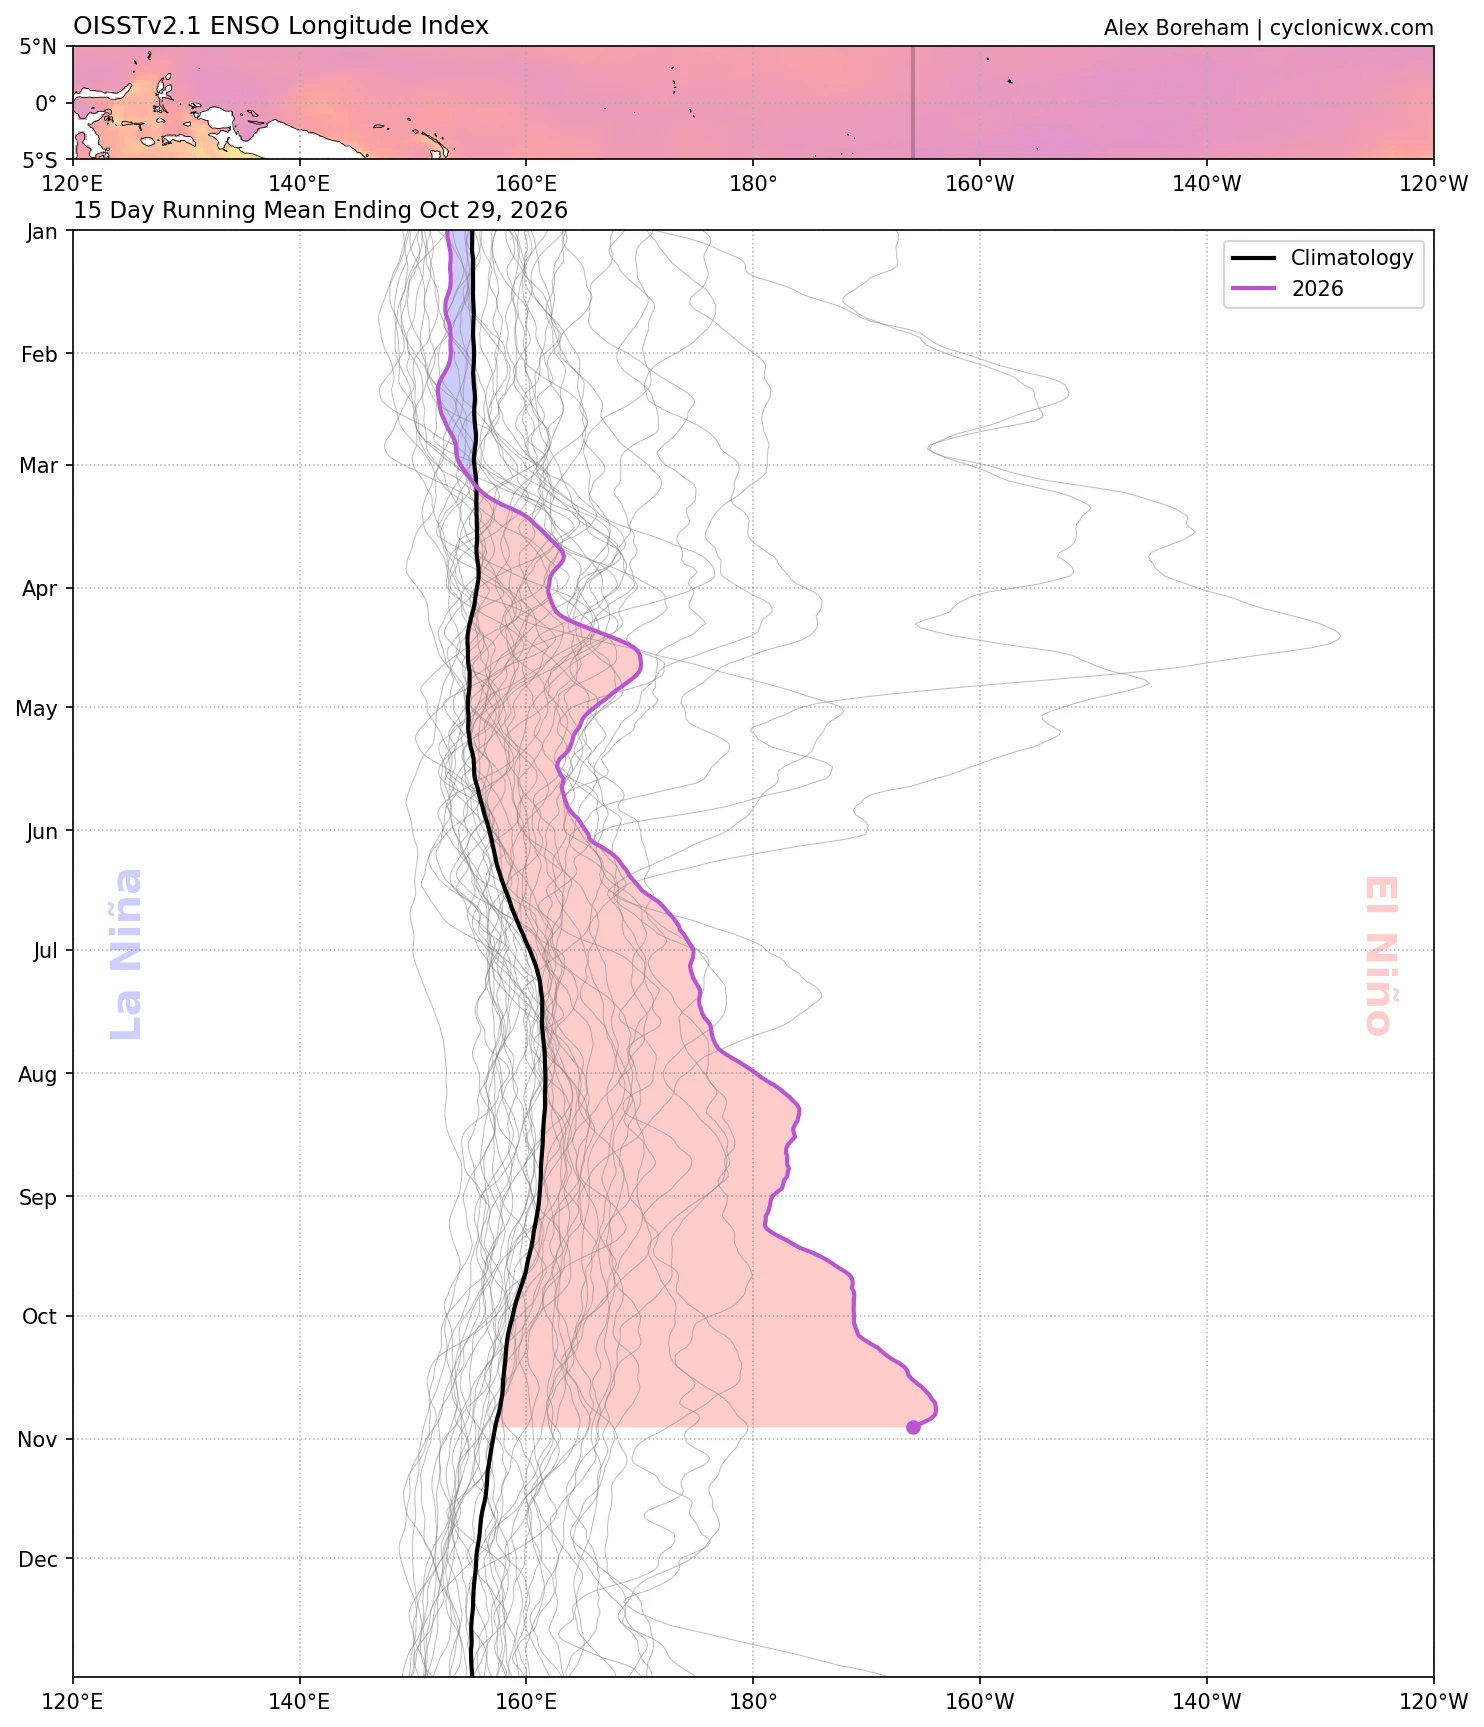
Image: Alex Boreham, cyclonicwx.com.
1997-98 is considered THE textbook example of an east-based El Niño. This year, the IPWP is about 1,000 miles farther east than it was in 97-98. That means the El Niño's effects will be shifted sooner down the timeline.
You can see that standing wave of energy in the upper level winds. The green shading below is rising air and the brown is sinking air. The rising air is parked over the central and eastern Pacific, right on top of the El Niño region, while the sinking air sits over the Maritime Continent.
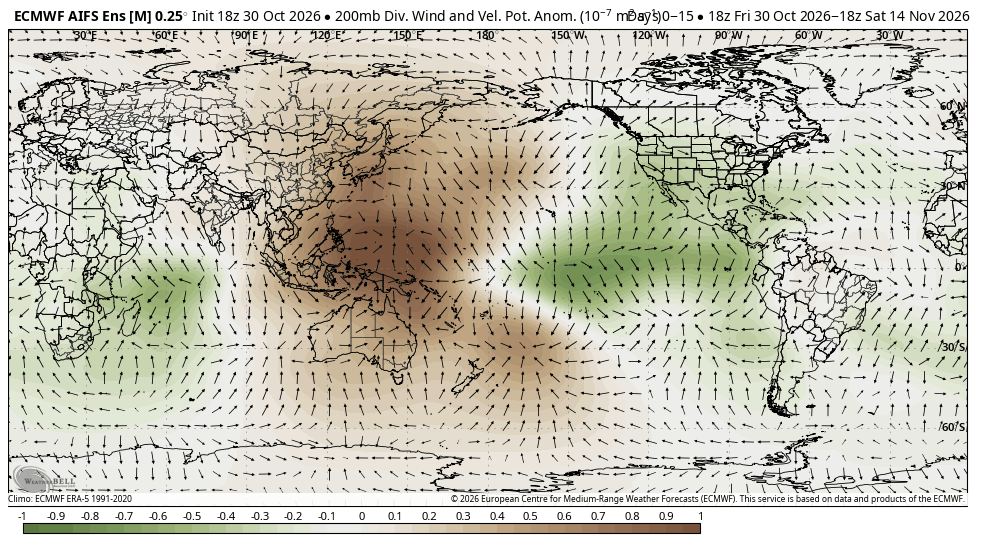
Image: WeatherBell.
So this El Niño is already robustly coupling, which adds support to the Gulf of Alaska trough.
MJO phase 3 and the +EAMT
Two more teleconnections also add substantial support to this pattern.
First, the MJO (Madden-Julian Oscillation) is in phase 3, over the Indian Ocean. This constructively couples with the standing wave of energy over the El Niño region, reinforcing the sinking air over the Maritime Continent, which strengthens the El Niño circulation, and it should keep the southern jet stream going.
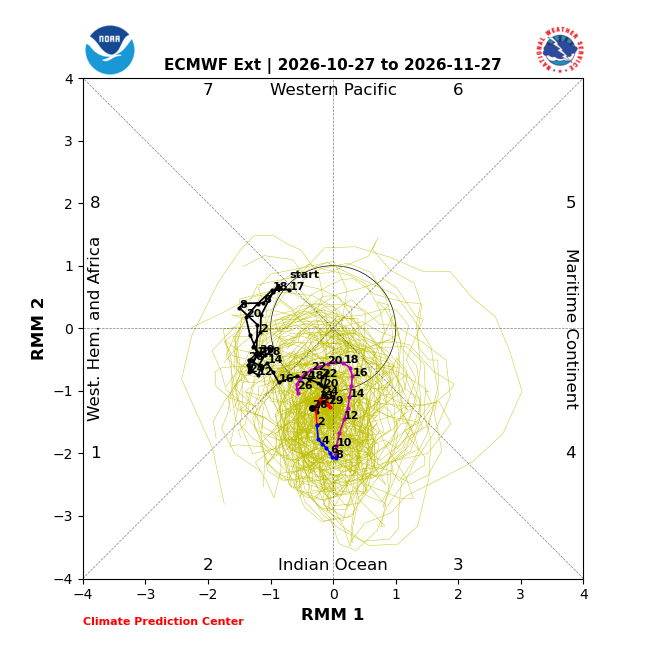
Image: NOAA Climate Prediction Center.
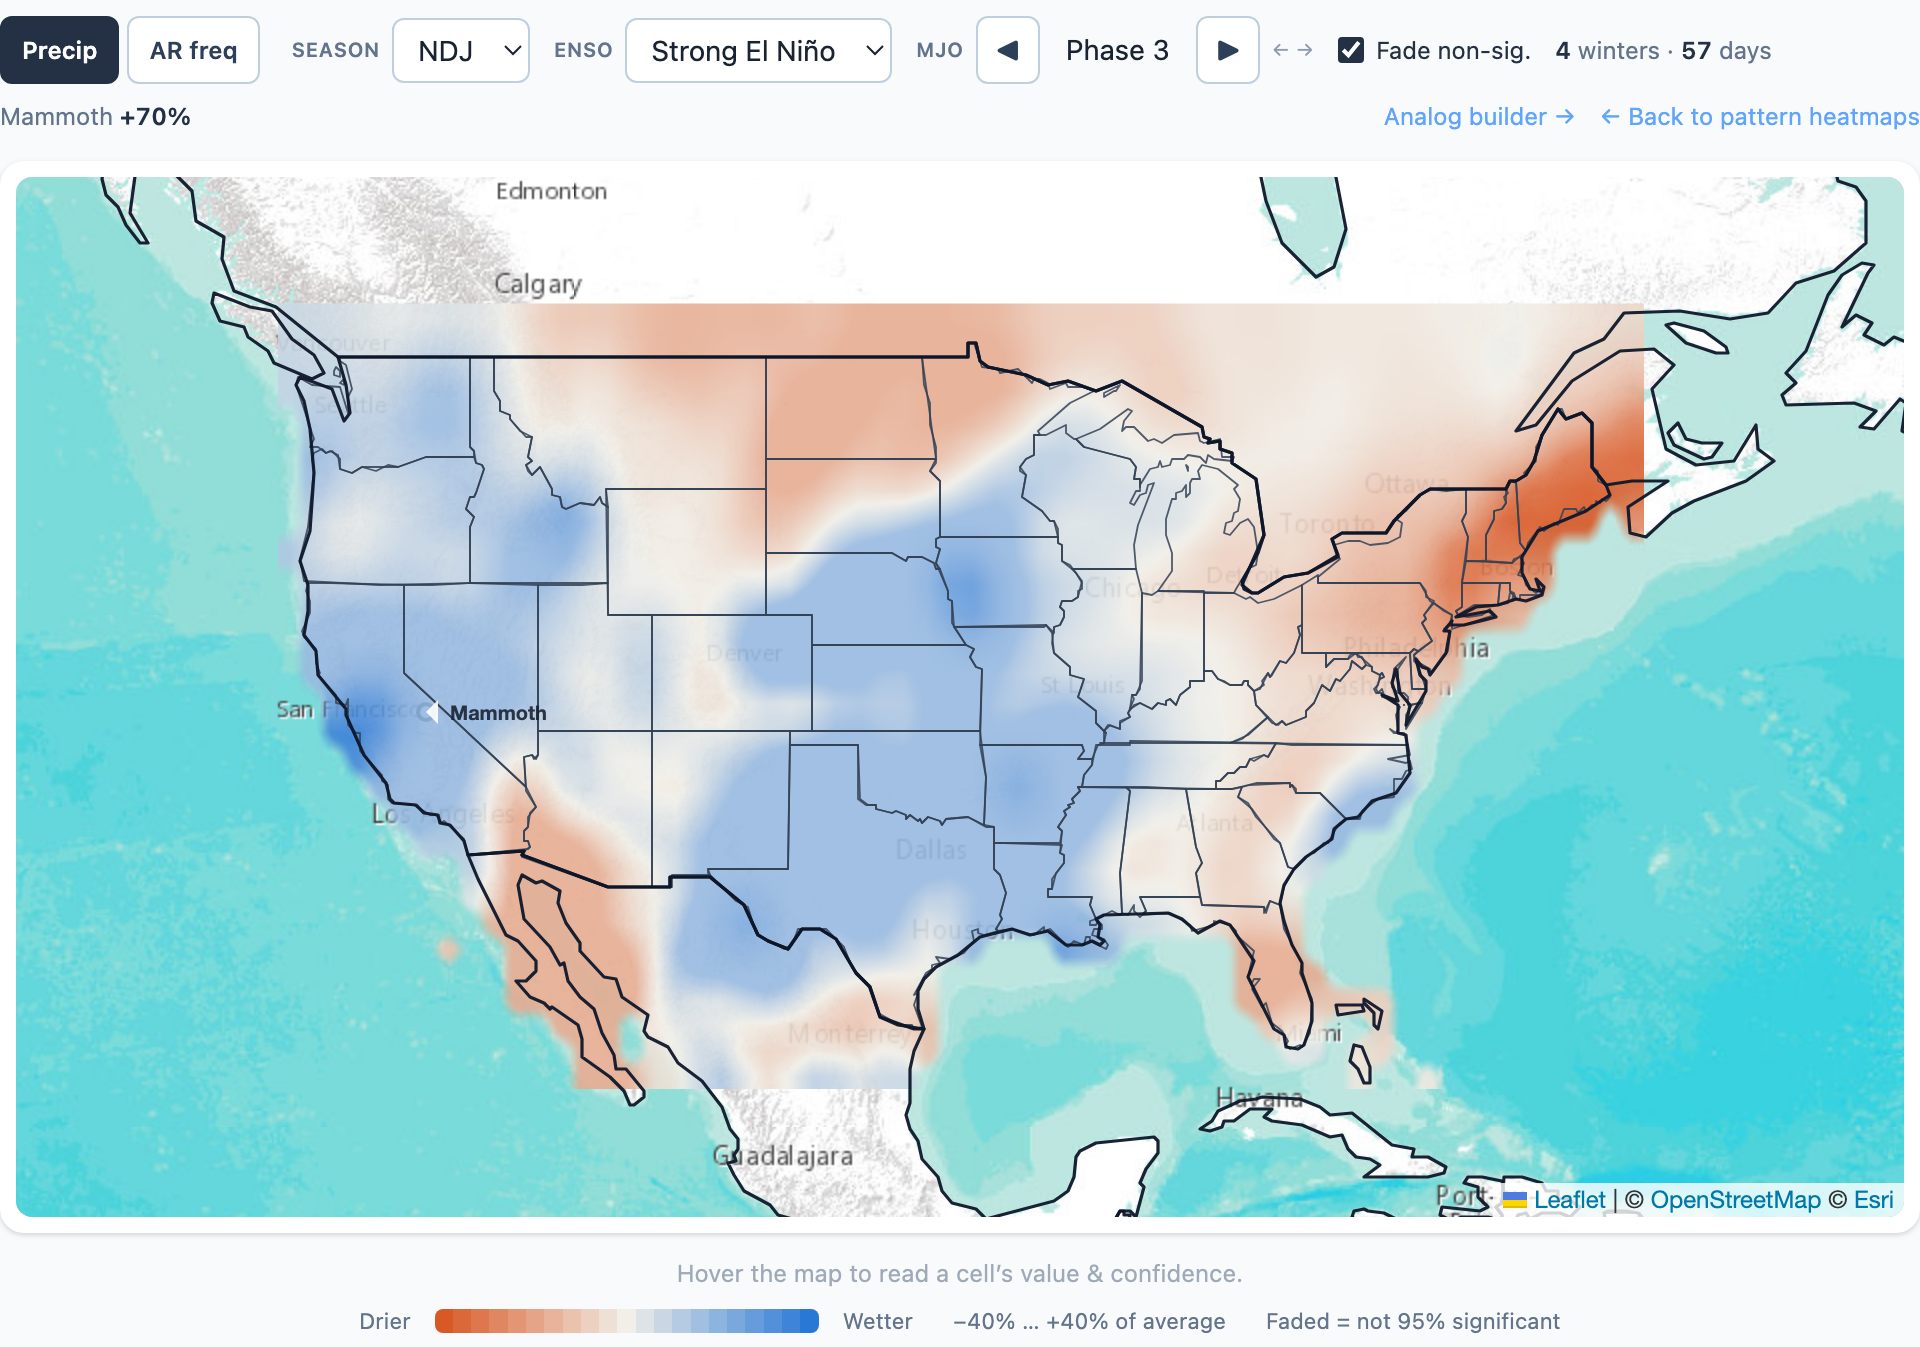
From our Climate Lab, here is what MJO phase 3 has looked like during strong El Niño winters in November through January. Blue is wetter than average and orange is drier, with Mammoth coming in around 70% above average. So the climo history support is also there.
Second, there is a strong positive East Asian Mountain Torque (+EAMT) ongoing. That is a fancy way of saying a big area of high pressure over East Asia is pushing up against the mountains of Asia. When that happens, it transfers momentum into the atmosphere and extends the Pacific jet stream, which feeds troughing downstream in the Gulf of Alaska. You can see that massive high over Mongolia and China in the Euro below.
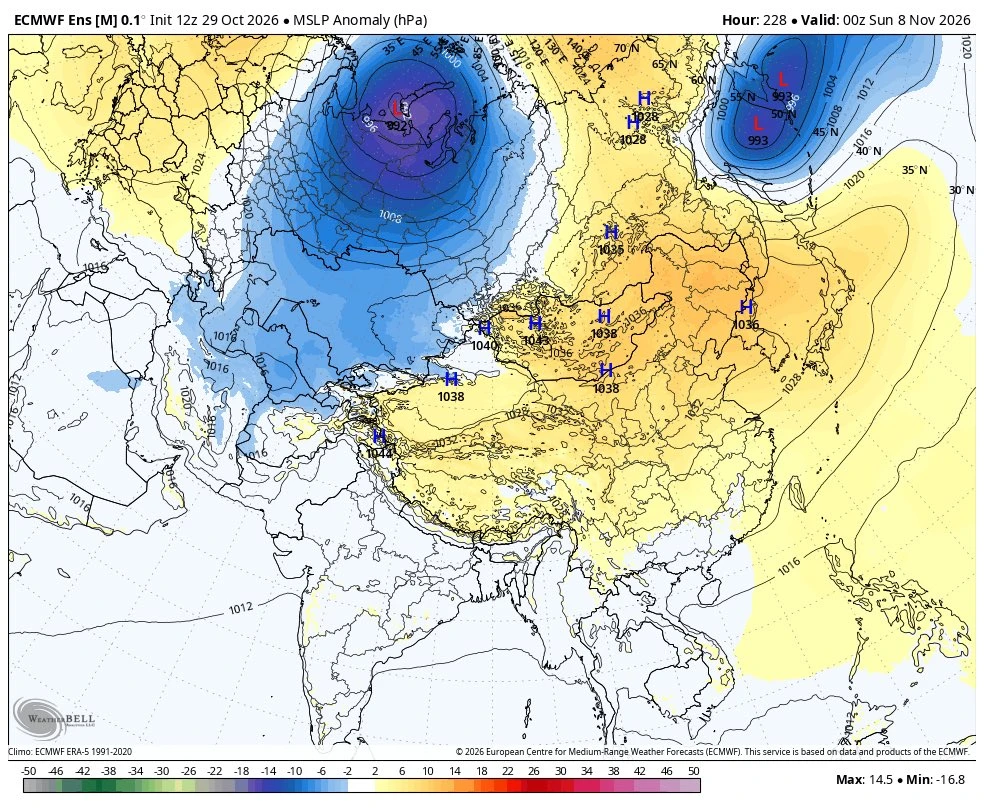
Image: WeatherBell.
This extended Pacific jet stream adds significant support to the pattern, and will likely contribute to driving active weather across the West in the coming weeks.
Interesting times ahead!
Enjoying the forecasts?
Eastside Weather is a passion project, but keeping it running comes with steady monthly costs: hosting, data feeds and the servers that crunch the model runs. Right now the site costs more than it brings in. Whatever you chip in goes straight back into keeping it going and building new tools.