Big Heatwave Coming to the West, Containment For Owens Valley Fires, And, How Well Can Winter in the Southern Hemisphere Predict Our Winter?
Overview
Both the Rock Fire and the Cinder Complex have seen promising containment gains, with little recent growth. Crews are increasingly shifting toward mop-up, patrol, line improvement, and suppression repair, although hot and very dry weather will continue to test the perimeter.
Meanwhile, a substantial heatwave is building across the West. Mammoth and Bishop will both approach all-time August high-temperature records.
Finally, we will look at whether winter conditions in places like Chile and New Zealand can tell us anything meaningful about the following winter in California.
Owens Valley Fires
Earlier this week, a thunderstorm over the Rock Fire produced strong downdrafts and lightning strikes, causing several new fires to pop up to the north. These were named the Cinder Complex Fire, and grew rapidly under gusty winds and hot conditions. Fortunately, crews have been able to make good progress on both the Cinder Complex and the pre-existing Rock Fire, just to the south.
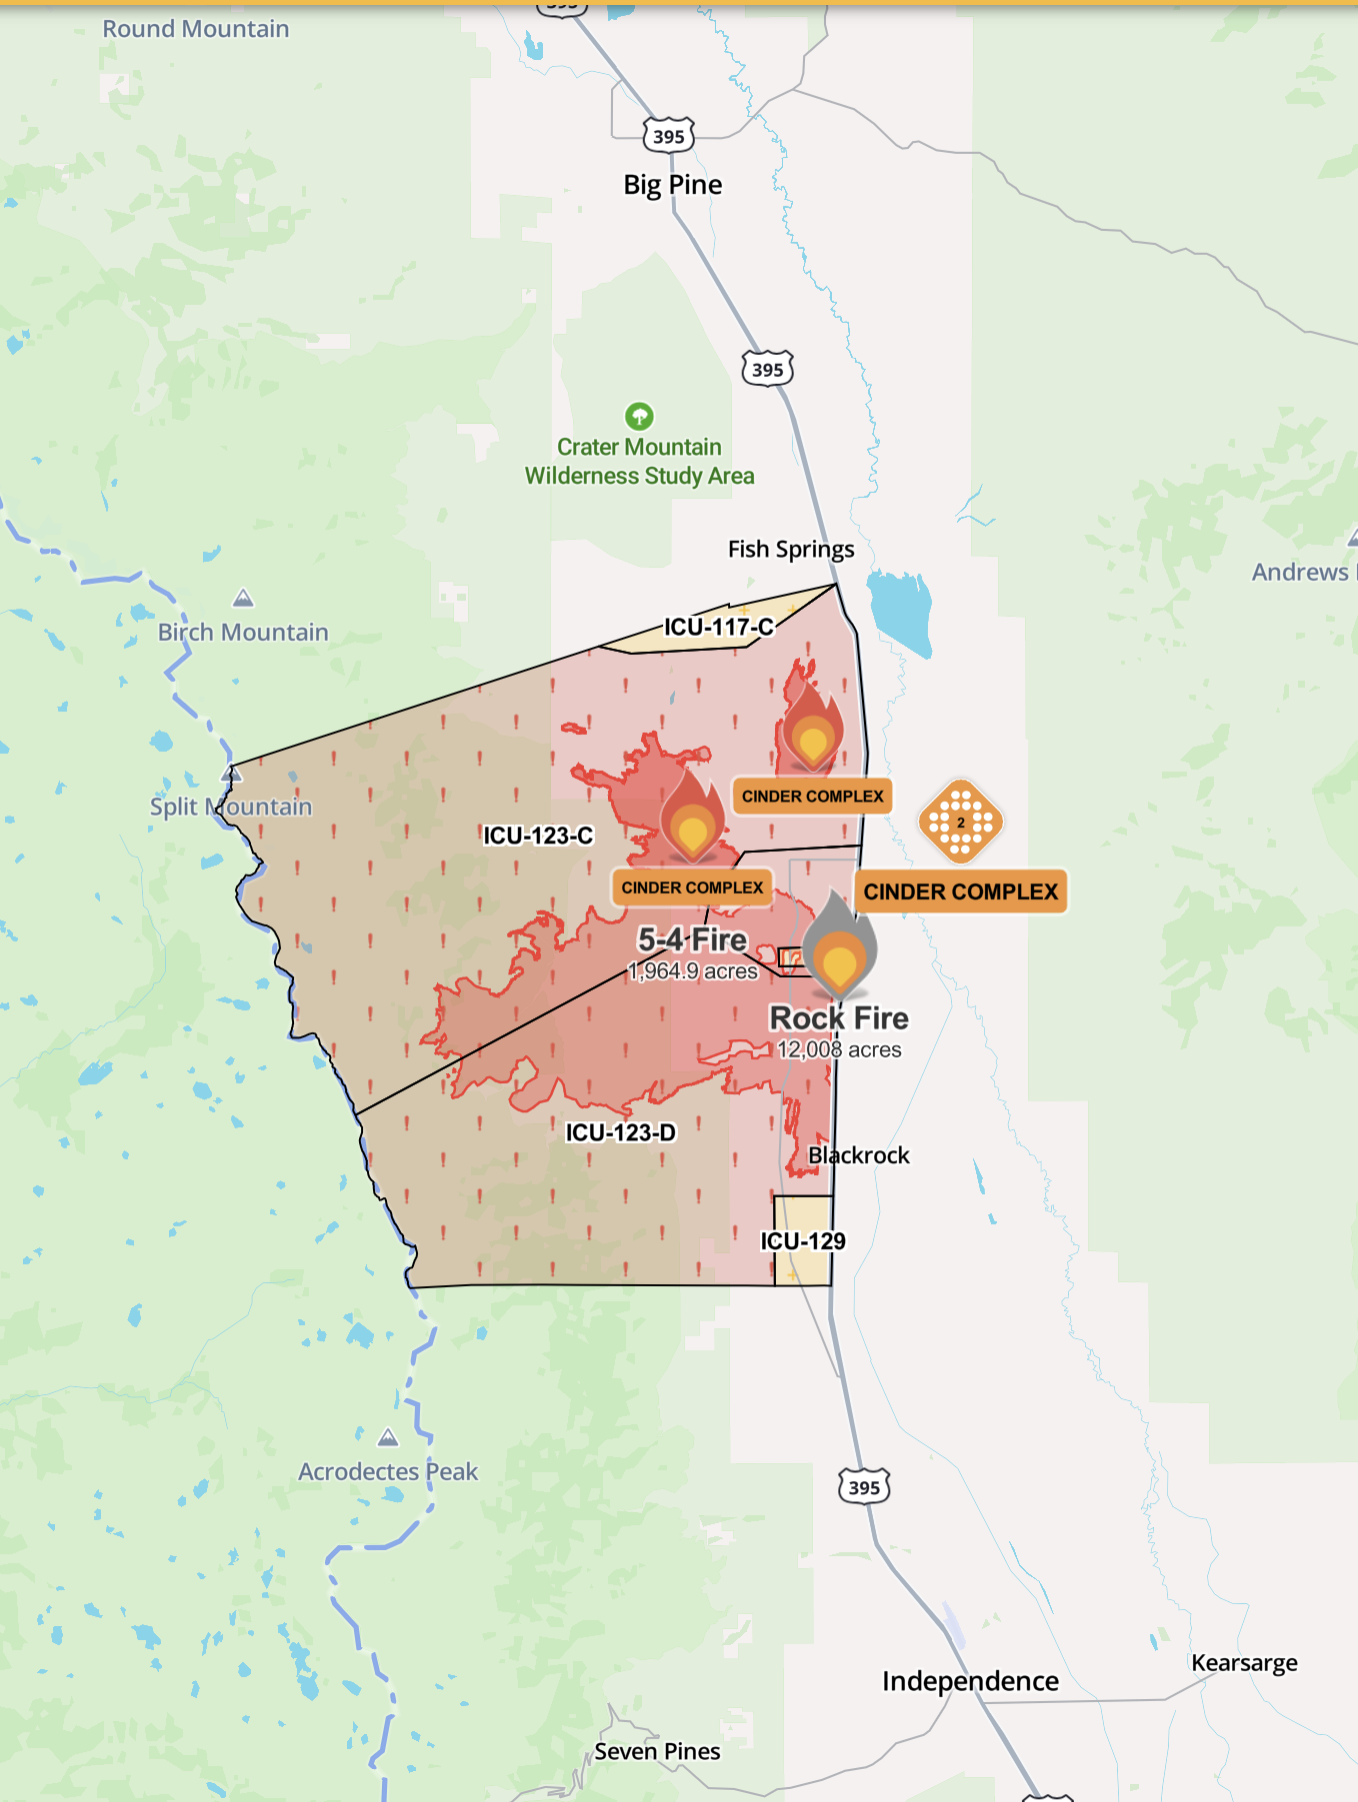
The Cinder Complex has also gained containment while holding near 2,800 acres. Crews are continuing to strengthen lines, mop up heat near the perimeter, patrol for flare-ups, and protect nearby infrastructure. As of 9:00 PM on Tue, Jul 28th, the Cinder Complex fire is 42% contained, and the Rock Fire is 71% contained.
The outlook is favorable, but afternoon heat, humidity near 10%, and gusty winds could still expose residual heat. In addition to that, a major heatwave is coming, which could lead to an increase in fire activity statewide.
Major Western Heatwave
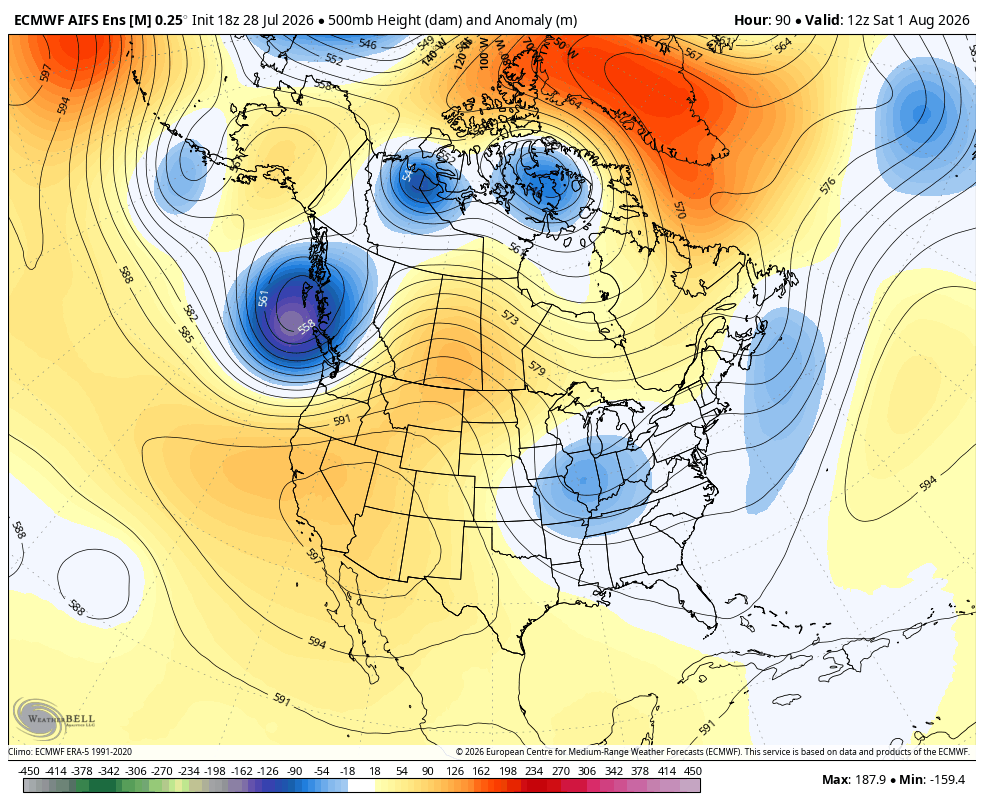
A strong ridge will expand across the western United States over the coming days, producing widespread heat from California into the Pacific Northwest and interior West. By August 1st, the ridge will be squarely planted over California, bringing significantly higher than average temperatures, with some local August temperature records likely to be approached.
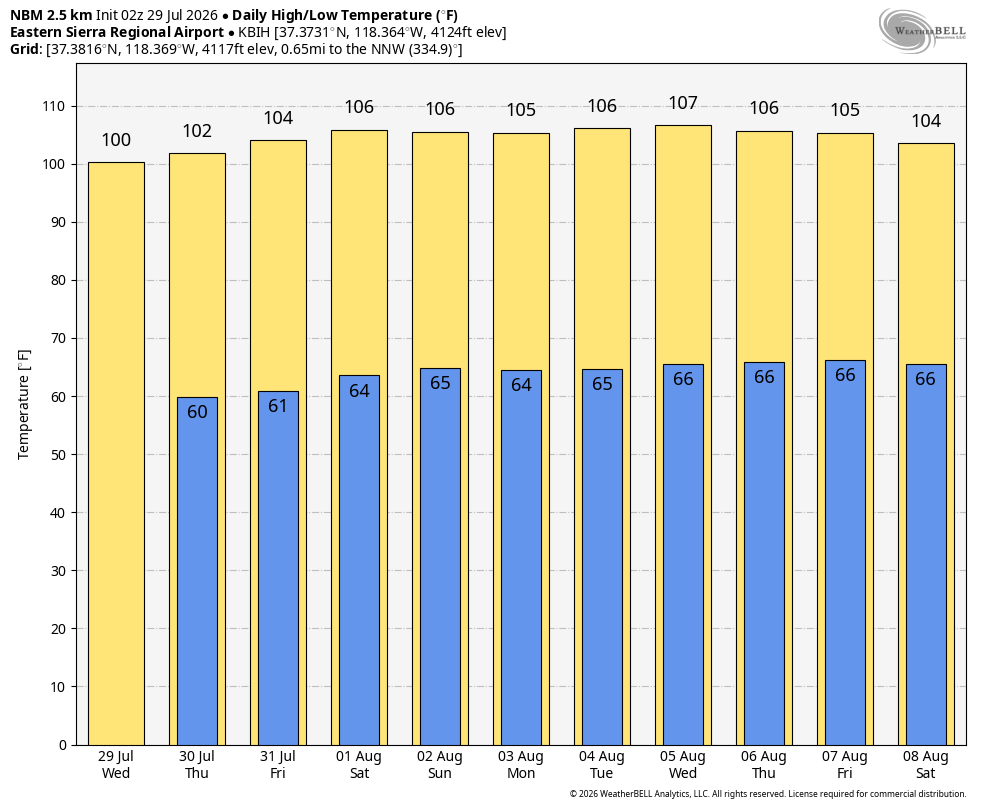
For example, Mammoth Lakes has an all time August high-temperature record of 91F, and Bishop 108F. Current model guidance suggests highs in the 105-107F range for Bishop the first week of August, and 86-90F range in Mammoth Lakes.
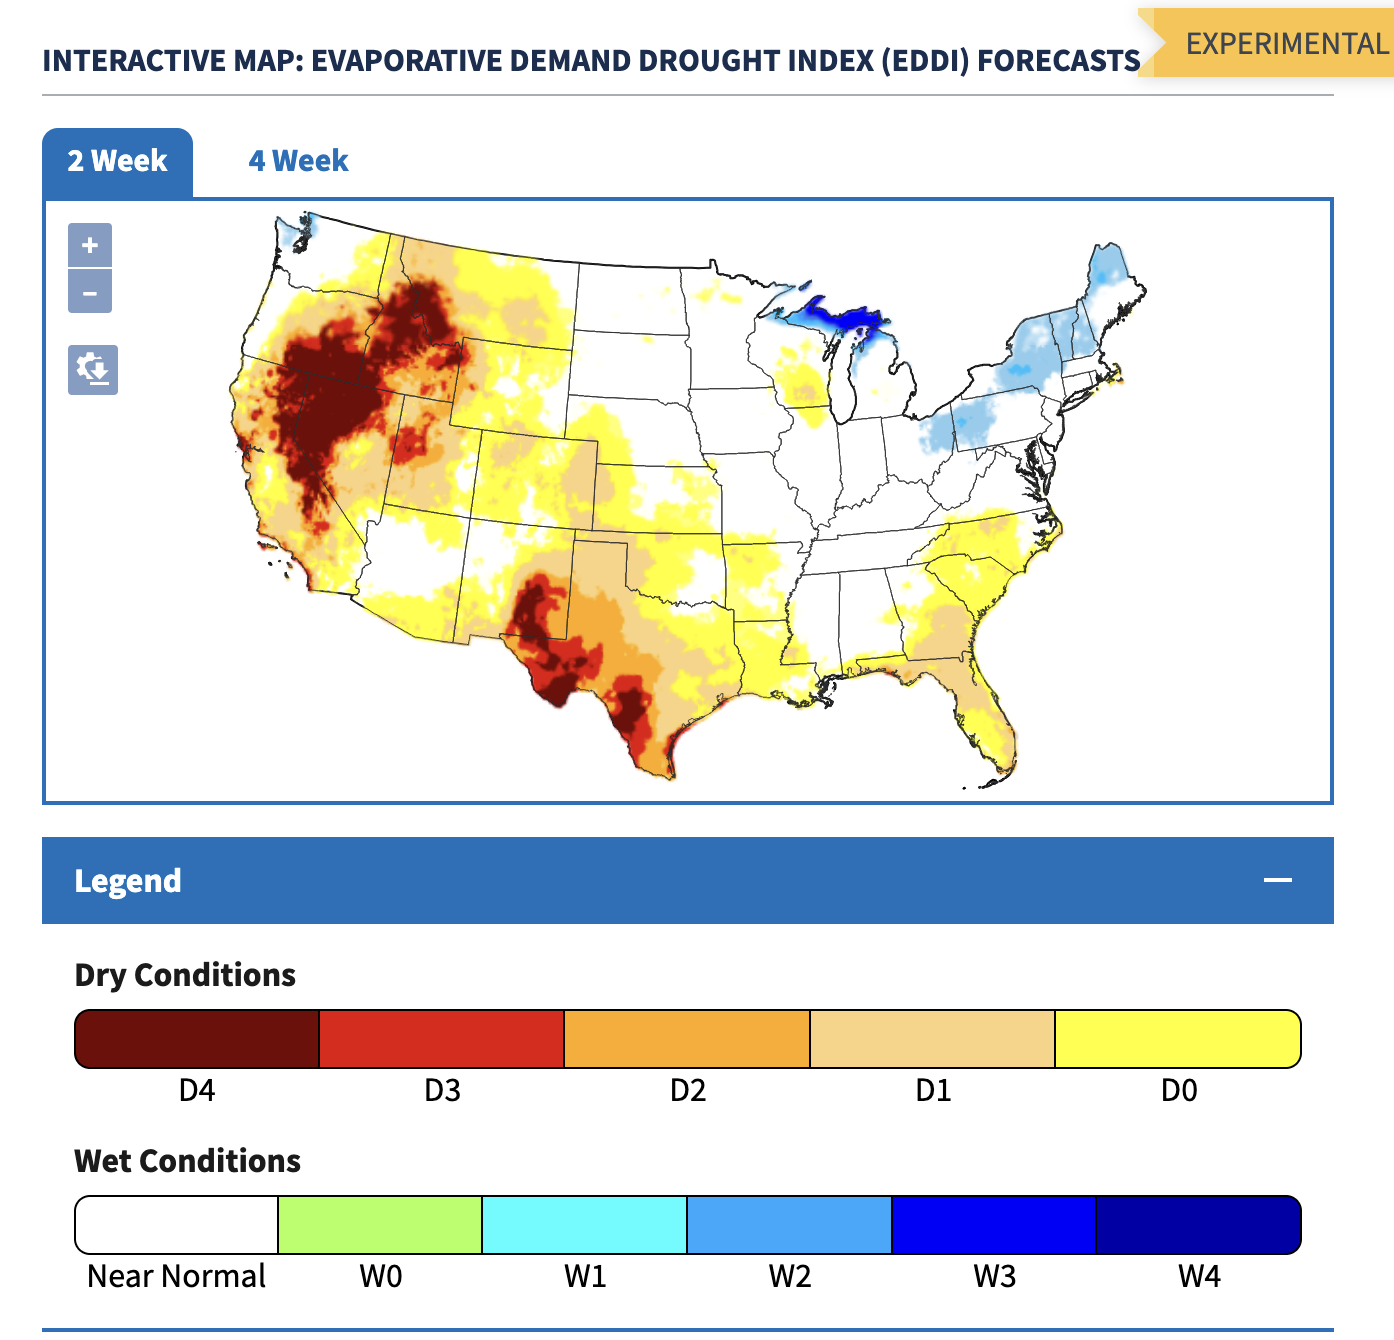
This heatwave is quite likely to raise fire-danger and could lead to an increase in fire activity as fuels experience significant evaporative demand. The below chart shows a two-week forecast of Evaporative Demand, with significant demand over the Sierra Nevada.
Can Southern Hemisphere Winter Predict Ours?
The other day, I got into an interesting discussion about whether winter in the Southern Hemisphere can help predict our upcoming one. A friend argued that Australia, and especially New Zealand, may be useful indicators, noting that New Zealand had a wet winter before our enormous 2022–23 season.
My thinking was different: under a strong El Niño, Chile may be the more relevant comparison. And our upcoming El Niño is very likely to be historic.
During El Niño, tropical convection shifts eastward across the Pacific, altering the Walker circulation and strengthening the subtropical jet streams in both hemispheres. This often increases storm activity near the 30–40° latitude bands, including central Chile during Southern Hemisphere winter and California during Northern Hemisphere winter.
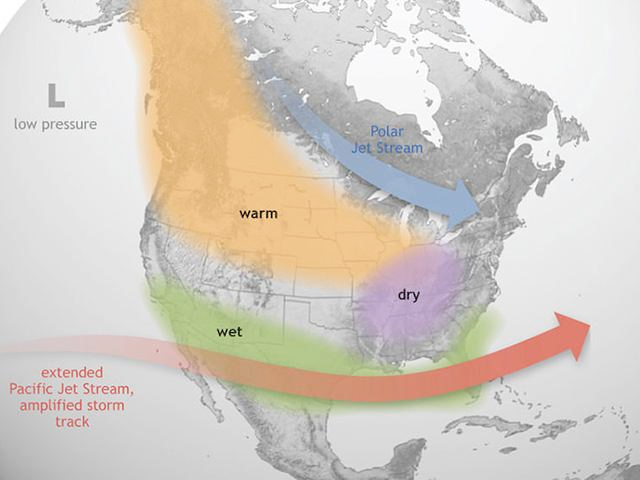
However, it is not that simple. The location of the warmest water and strongest tropical convection matters enormously. In 2015–16, the atmospheric response favored a storm track aimed farther north than many Californians expected, despite the event’s exceptional oceanic strength.
Still, if Chile is already seeing a robust subtropical-jet response, that could provide an early clue that this El Niño is strongly coupled to the atmosphere.
So, I ran a statistical analysis comparing winter precipitation near Chillán, Chile, and Ruapehu, New Zealand, with Mammoth’s following November–March precipitation. This uses ERA5 data, which is a coarse grid around Mammoth. Variations do exist between what Mammoth measures in terms of snowfall and what the coarse ERA5 data shows, but the general correlation should still be sound.
Across all 85 years, New Zealand has a modest positive correlation with Mammoth, with an r-value of +0.38, while Chile has essentially no correlation at all. My friend was therefore onto something: in the full historical record, New Zealand has shown some limited predictive value.
Notice 2022–23 in the upper-right corner—both New Zealand and Mammoth were exceptionally wet.
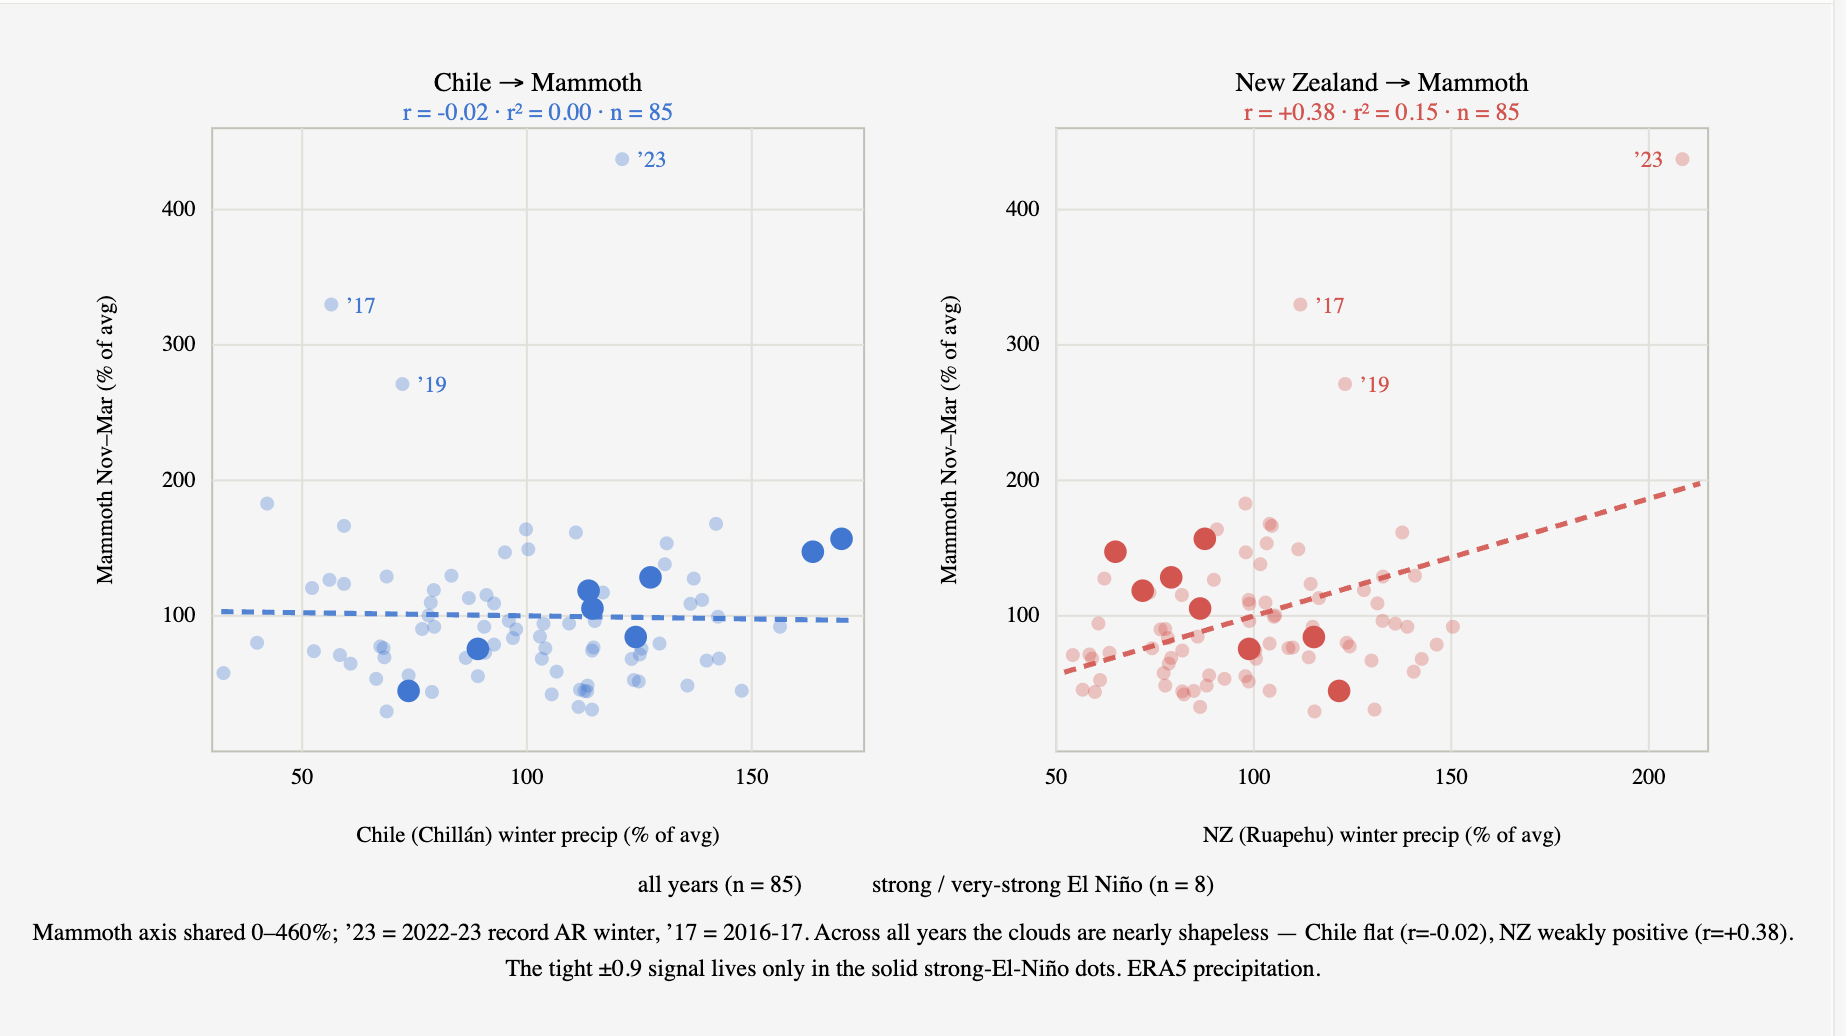
But when we restrict the analysis to the eight strong and very strong El Niño events, the relationship flips completely.
Chile shows an extremely strong positive correlation with Mammoth’s following winter, with r = +0.92, while New Zealand shows a strong negative correlation of r = −0.83.
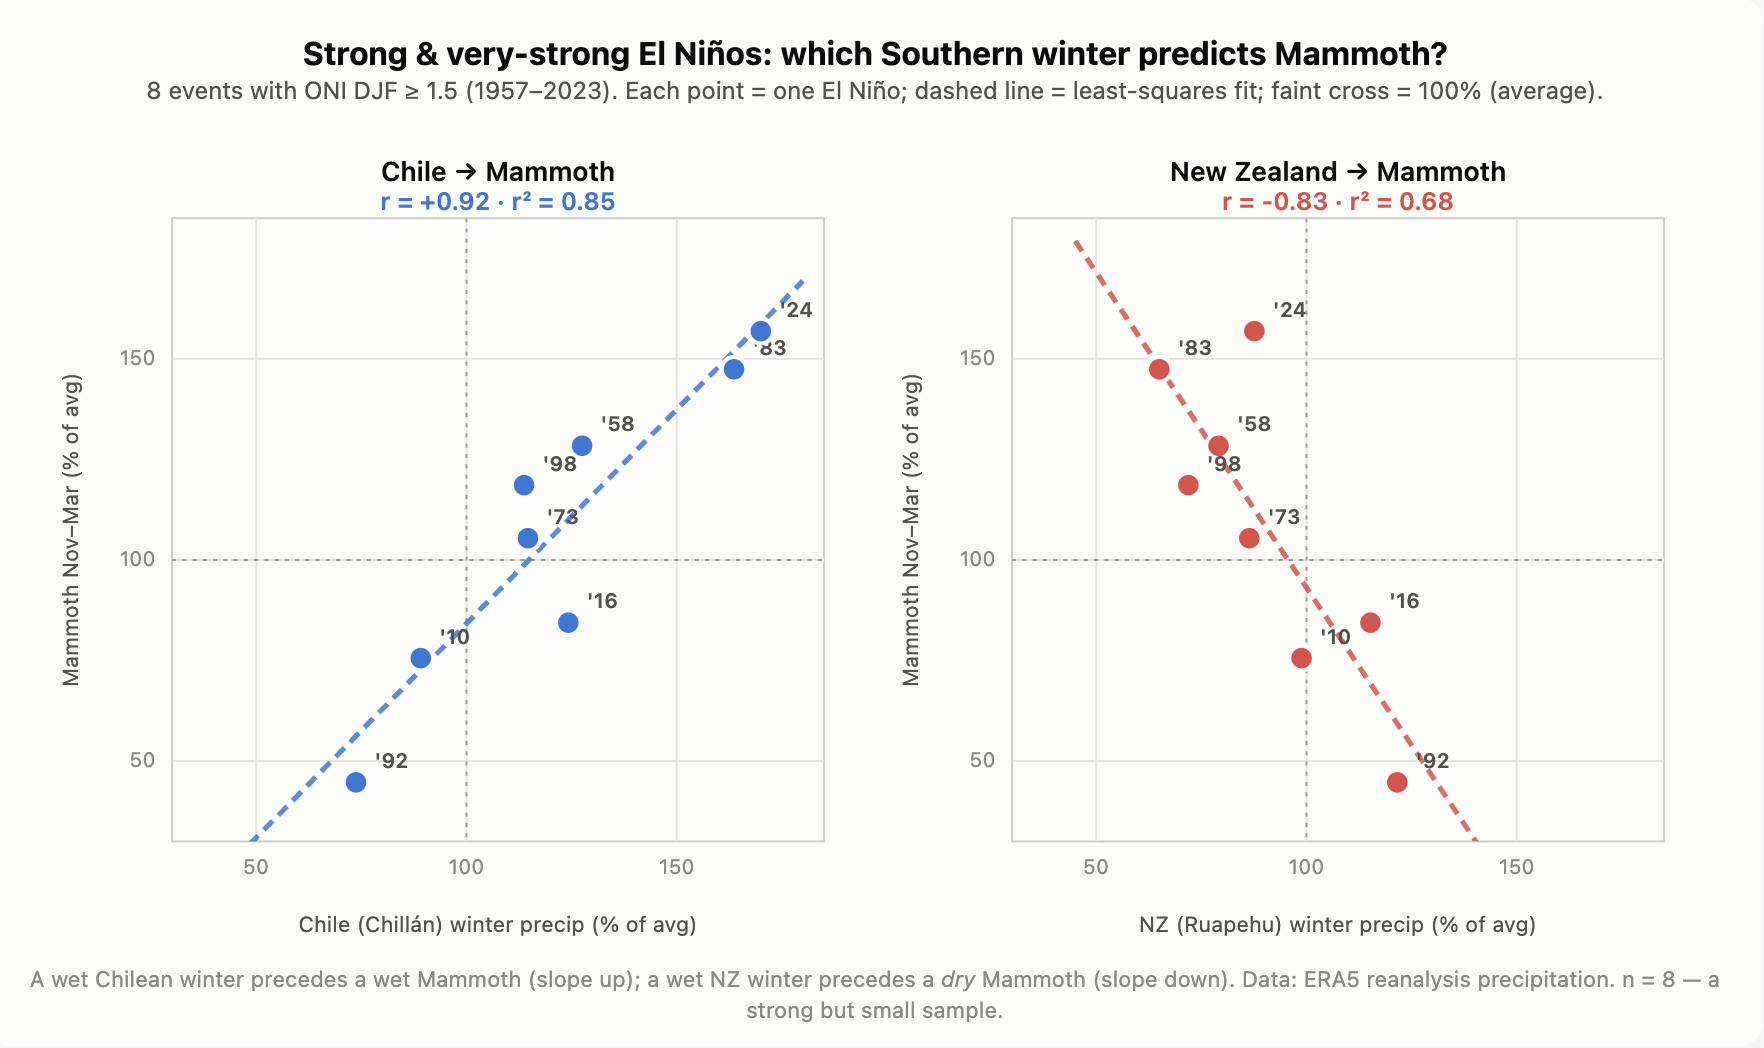
This makes sense as Strong El Niño events create persistent, planetary-scale regions of rising and sinking motion across the Pacific. Chilean precipitation could be an early indicator of how strongly the tropical Pacific is coupled to the atmosphere and where the resulting subtropical jet response is setting up.
New Zealand, meanwhile, often sits within a different part of the circulation response. During these strong events, a wet New Zealand winter may actually indicate a pattern less favorable for California several months later.
And this developing El Niño is already showing signs of robust atmospheric coupling:
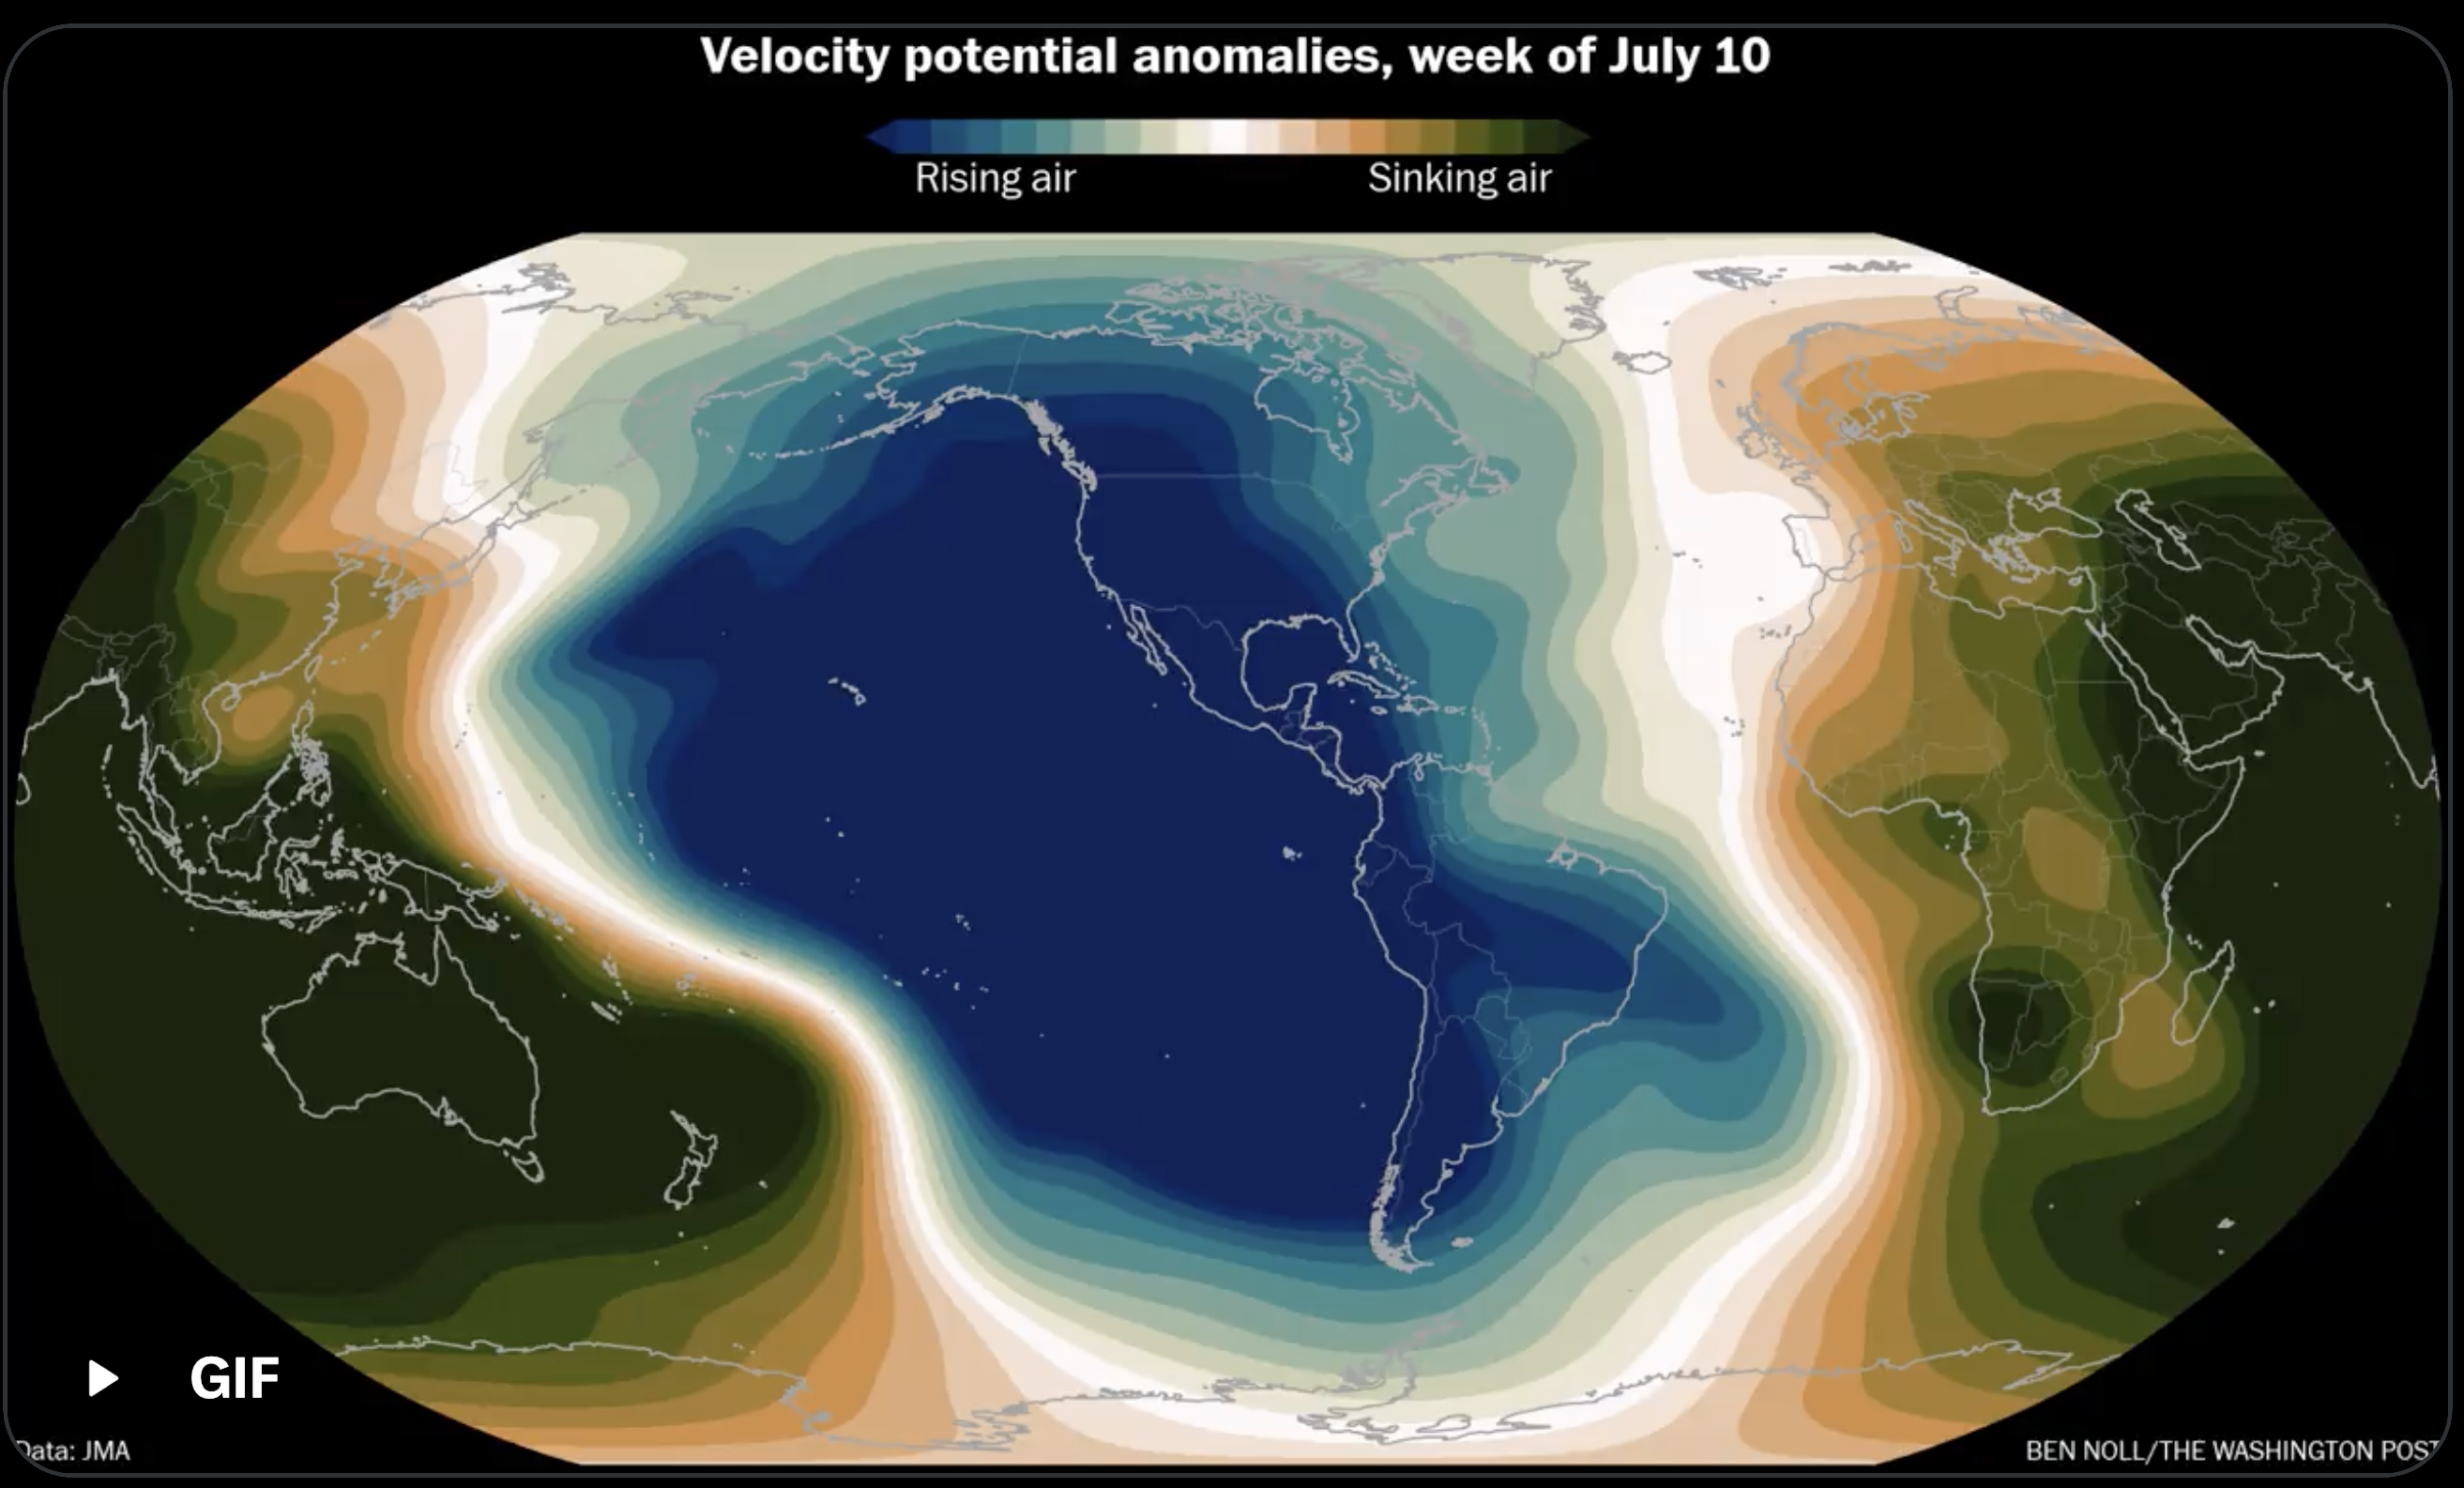
Correlations this strong can be heavily influenced by one or two winters, and they do not prove that Chilean precipitation directly causes the following outcome at Mammoth.
Still, the result is fascinating. Across all winters, New Zealand appears somewhat more informative. But during strong El Niño events specifically, Chile has historically been the far better indicator.
This year, Chile is having an extraordinary winter.
That does not guarantee a huge winter in Mammoth—but within the narrow set of strong El Niño analogs, it is certainly more encouraging than discouraging.