Monsoonal Moisture Returns, the Heatwave Leaves, and an El Niño Update
Overview
My friends...
This weekend will feature increasing thunderstorm coverage as monsoonal moisture intrudes into the Sierra Nevada. Yesterday evening brought some surprise showers around Mammoth and Crowley Lake, with heavy downpours, thunder, and gusty outflow winds observed. Next week will feature continued chances for monsoonal moisture, as well as a much-needed cooldown as a West Coast trough builds in.
Finally, the August editions of the Euro Seasonal model, CanSIPS model, and NMME multi-model ensemble have landed, and continue to show a truly historic El Niño event unfolding. The implications for our upcoming winter are far from guaranteed.
Weekend Thunderstorms
Yesterday evening featured some unexpected thunderstorms over Mammoth and Crowley Lake. These resulted in heavy rain, thunder and lightning, and rather gusty outflow winds. These thunderstorms were very poorly modeled, with no models showing nearly this amount of precipitation.
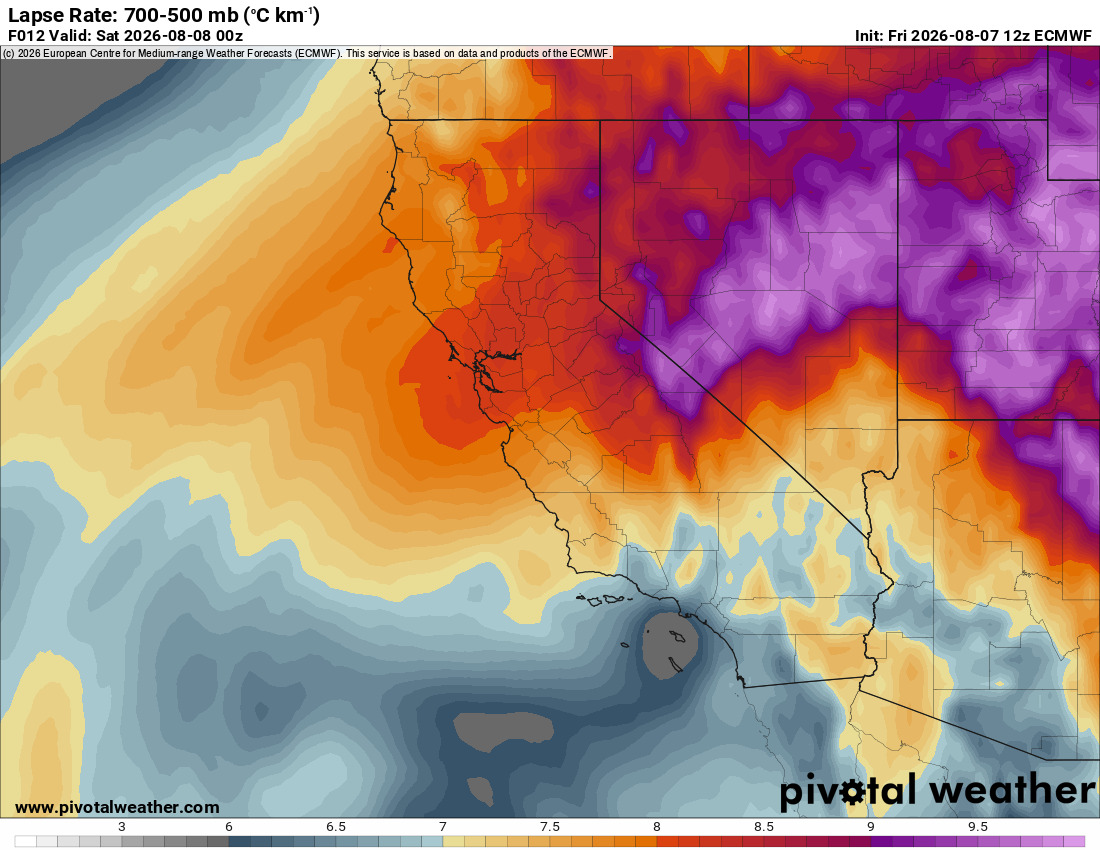
Models do show increasing thunderstorm coverage through the weekend beginning this afternoon, as mid-level moisture and lapse rates are favorable for storm development. Thunderstorms will occur primarily in the afternoons, and will be scattered in nature. The exact timing, placement, and precipitation amounts will be widely varied and difficult to predict. Hikers, climbers, and other recreationists should watch the sky and be prepared to descend to lower ground as thunderstorms build in. Below you can see favorable lapse rates and mid-level moisture:
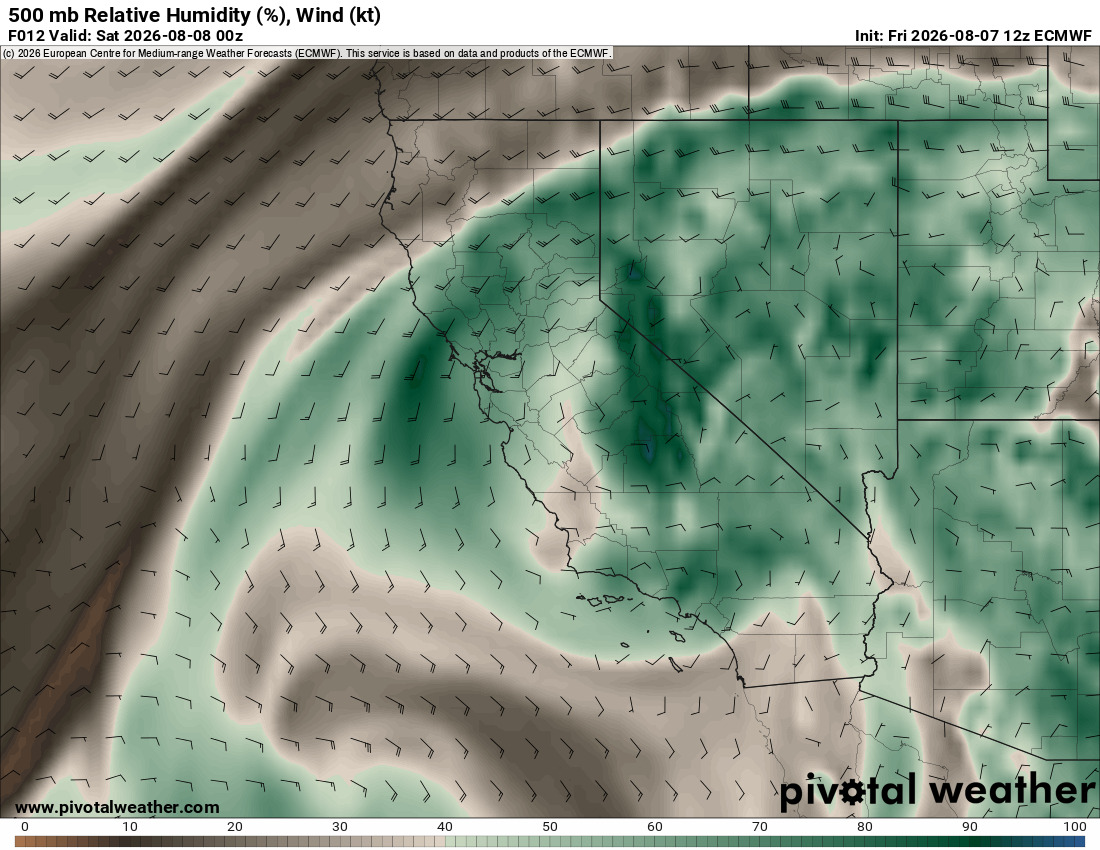
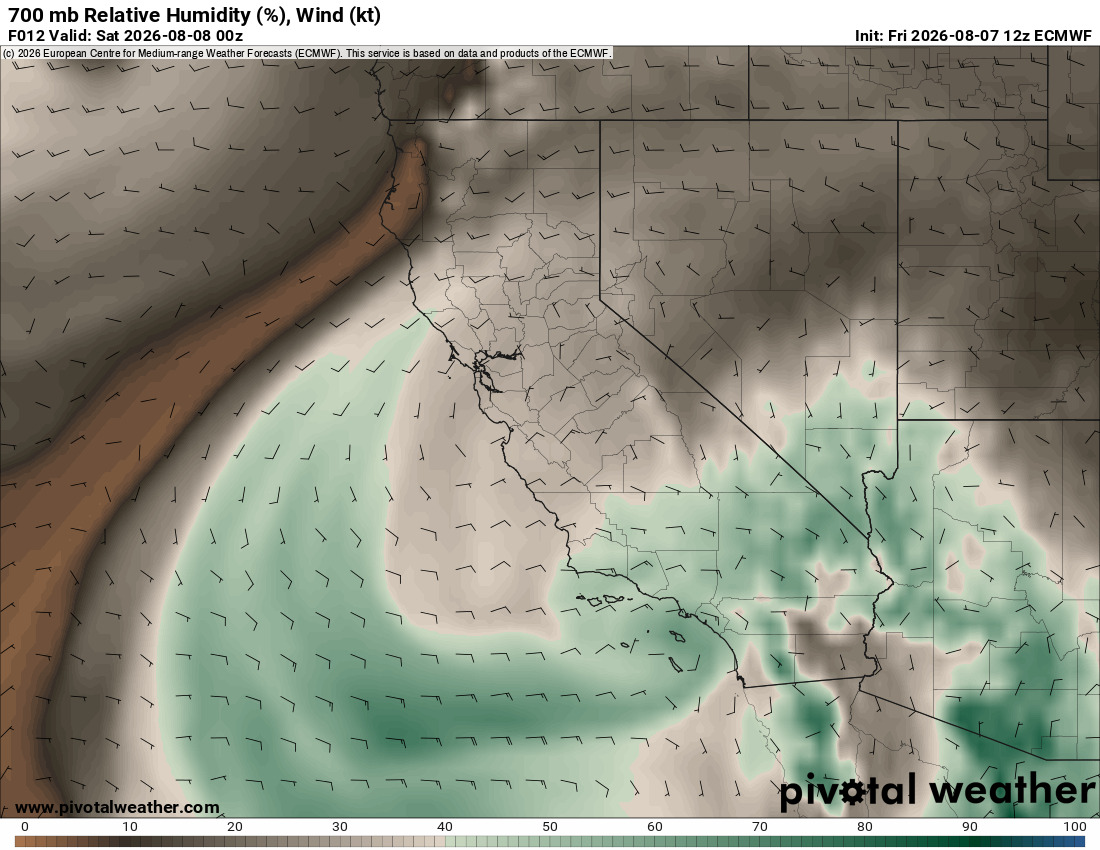
However, the lower-level moisture support is weak, which means that lighter precipitation may struggle to reach the ground, while heavier downpours will be more likely to make it to the surface. Unfortunately, there will also be an elevated risk of dry lightning outside of these rain cores.
More Monsoonal Moisture Next Week?
Scattered/isolated thunderstorms will remain possible throughout the next week, as chances for more widespread monsoonal moisture increase again toward the end of next week. Below you can see a preliminary lightning flash density forecast for next weekend:
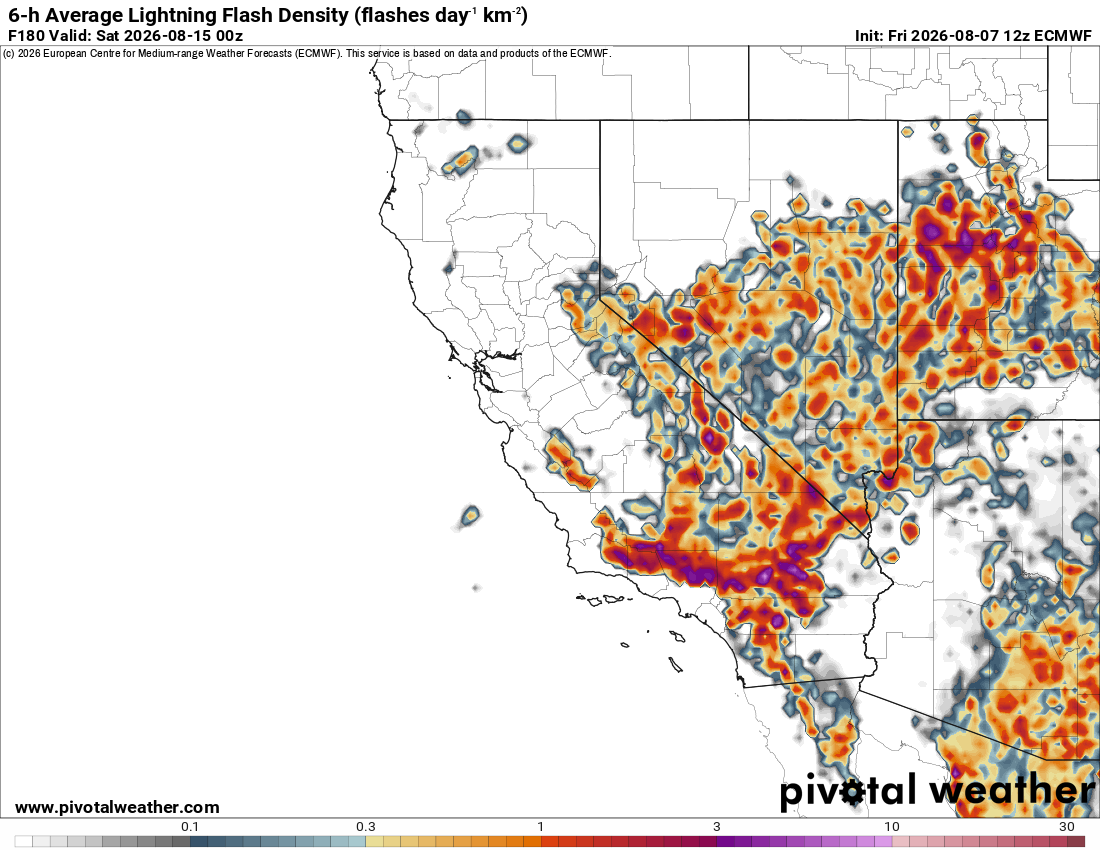
This coincides with a much-needed West Coast trough, which will keep temperatures much lower than they have been! This West Coast trough is favored by our climatology, with the Madden-Julian Oscillation into phase 6.
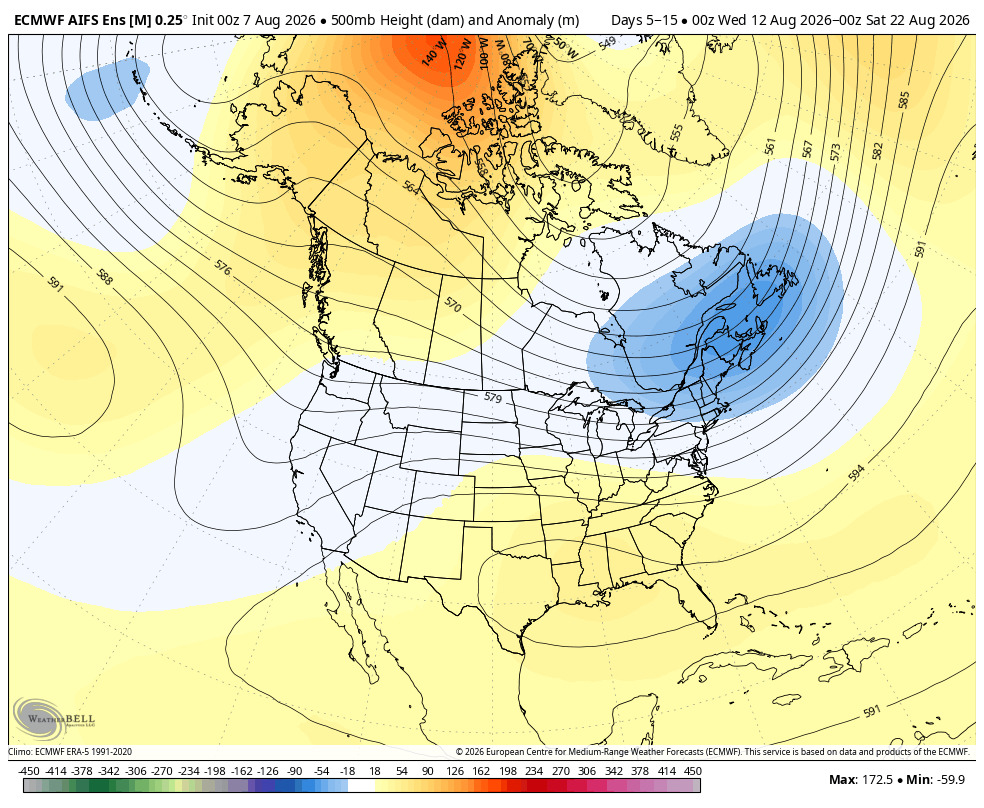
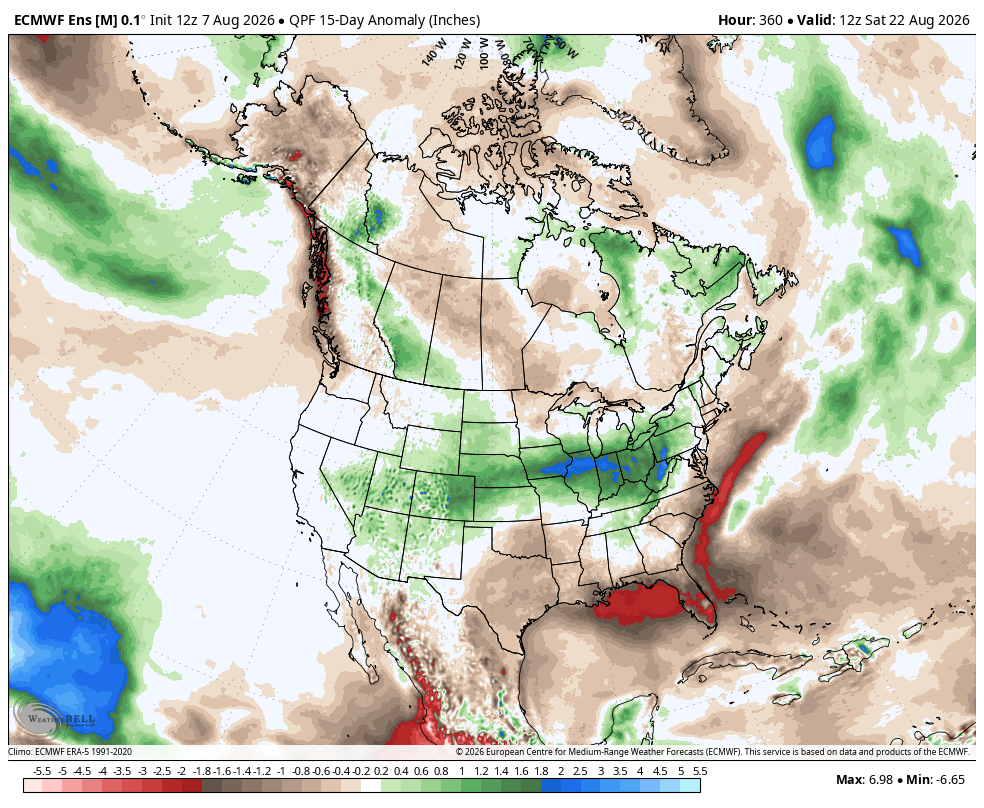
It remains to be seen how prolonged monsoonal moisture intrusions will be into our region, but the chances appear to remain elevated in the mid-range, and this signal shows up on ensembles, now showing above-average precipitation over our region for 15 days, with a broad monsoon signal for the entire SW.
Longer Range
Longer range, the monsoon is generally expected to continue to be more active, coinciding with an active eastern Pacific hurricane season. The 46-day Euro Weekly models show a precipitation signal similar to what I issued as a seasonal outlook in July:
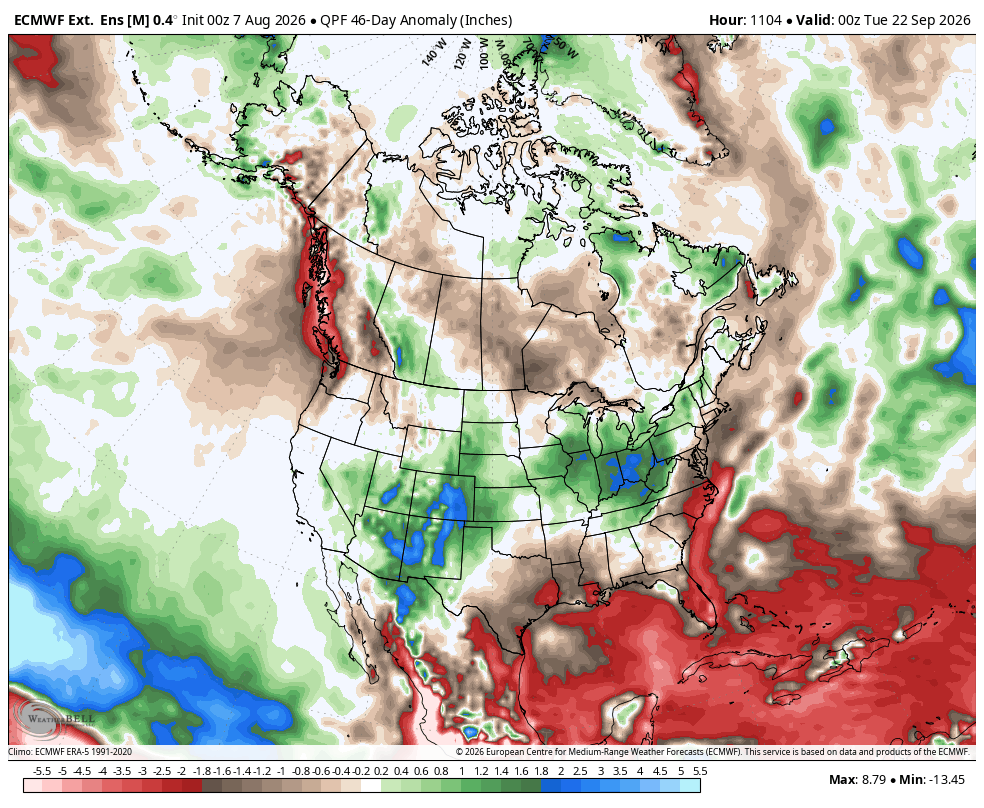
Versus my outlook:
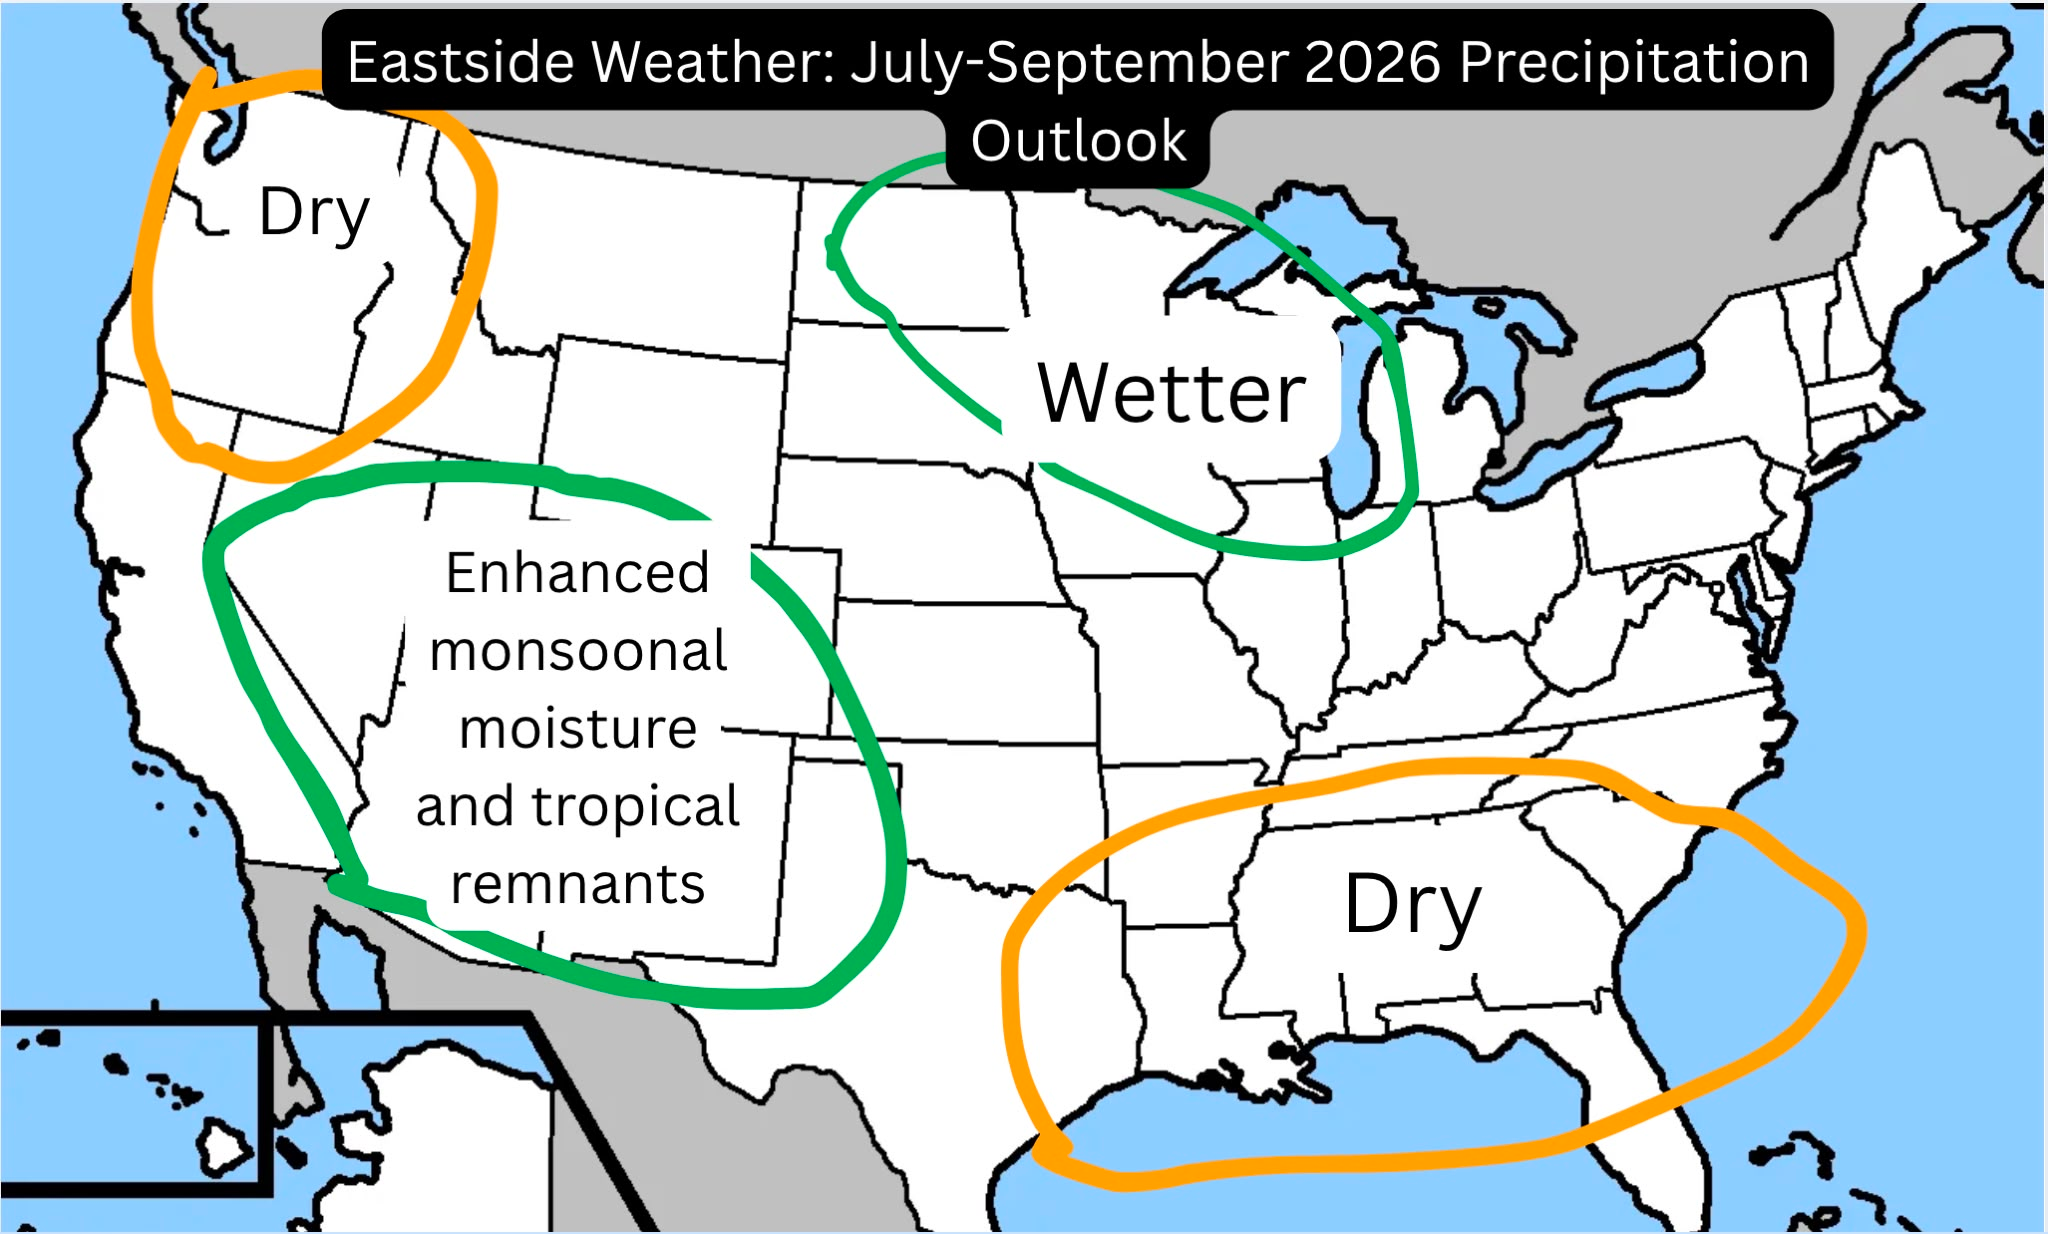
Things can get really interesting as tropical storms/hurricanes from the eastern Pacific can start to send their moisture or even their remnants our way... We'll continue to monitor for any such events.
El Niño Update
El Niño continues to develop at a historic rate, with all the latest models now showing a historic-level event unfolding this fall. The latest NMME multi-model ensemble was released today, and shows a peak monthly-mean Niño 3.4 anomaly of +4°C. For comparison, the highest weekly Niño 3.4 value ever observed is approximately +2.8°C, and on the 3-month ONI the record is lower still. +4°C would be off the charts.
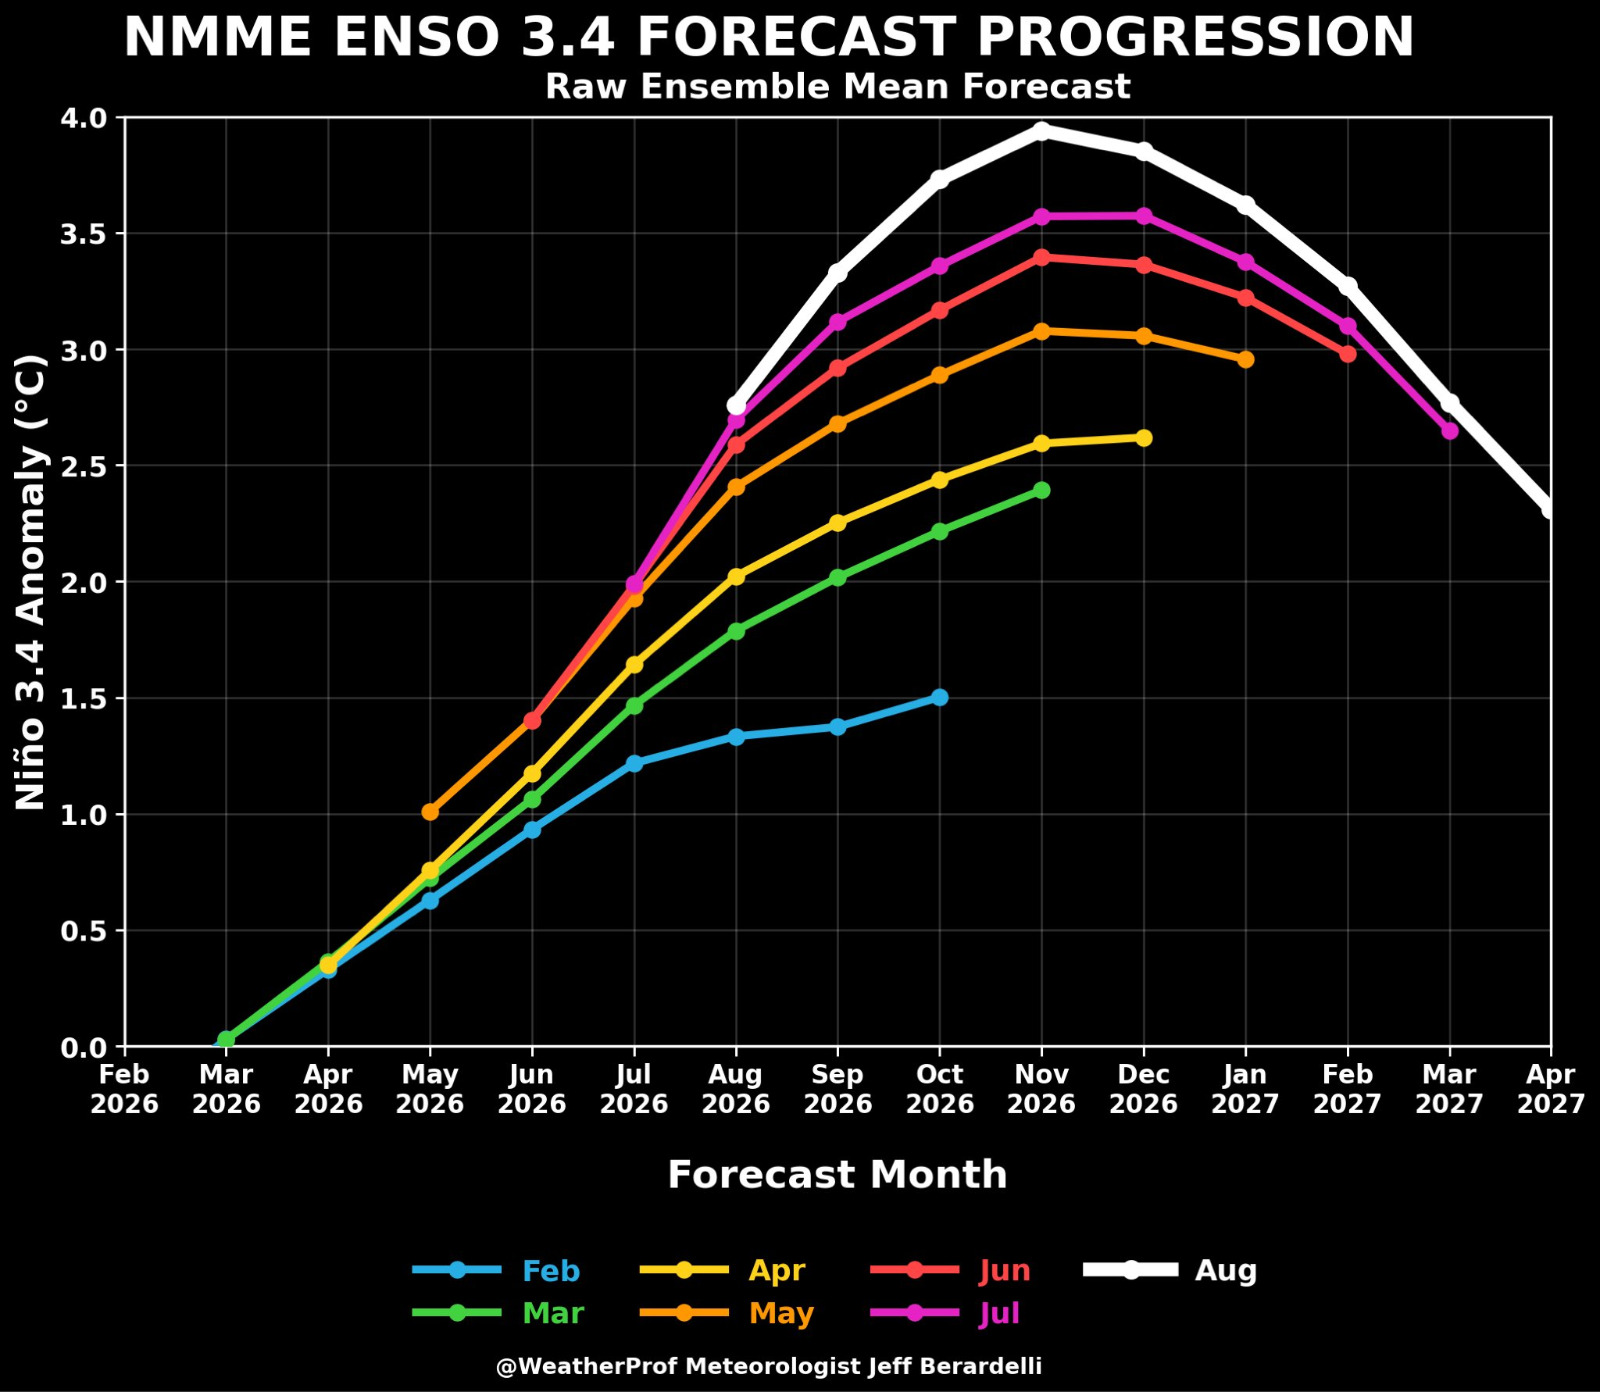
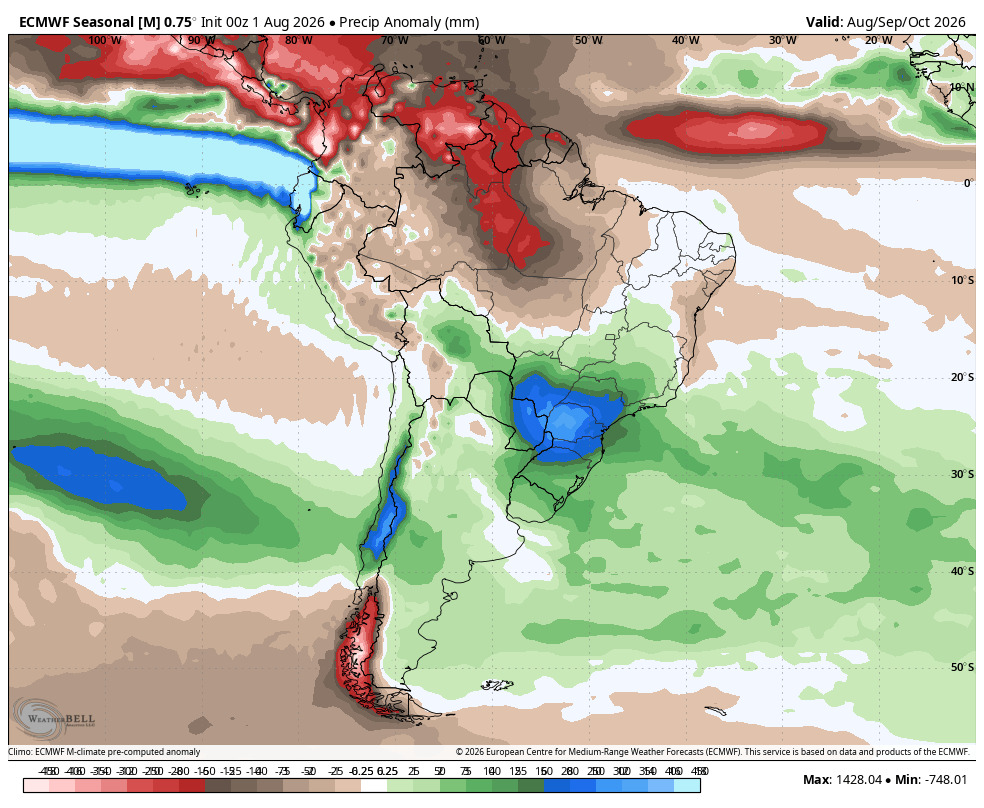
It is hard to put into words how extreme this truly would be. And the models show a canonical response at the mid-latitudes, both ongoing in South America, and forecast for North America. The canonical response is for a more active subtropical jet stream, with increased precipitation along the 30–40 degree band north/south of the equator. Below you can see the upcoming pattern forecast in South America:
Along with the Dec-Feb forecast for North America:
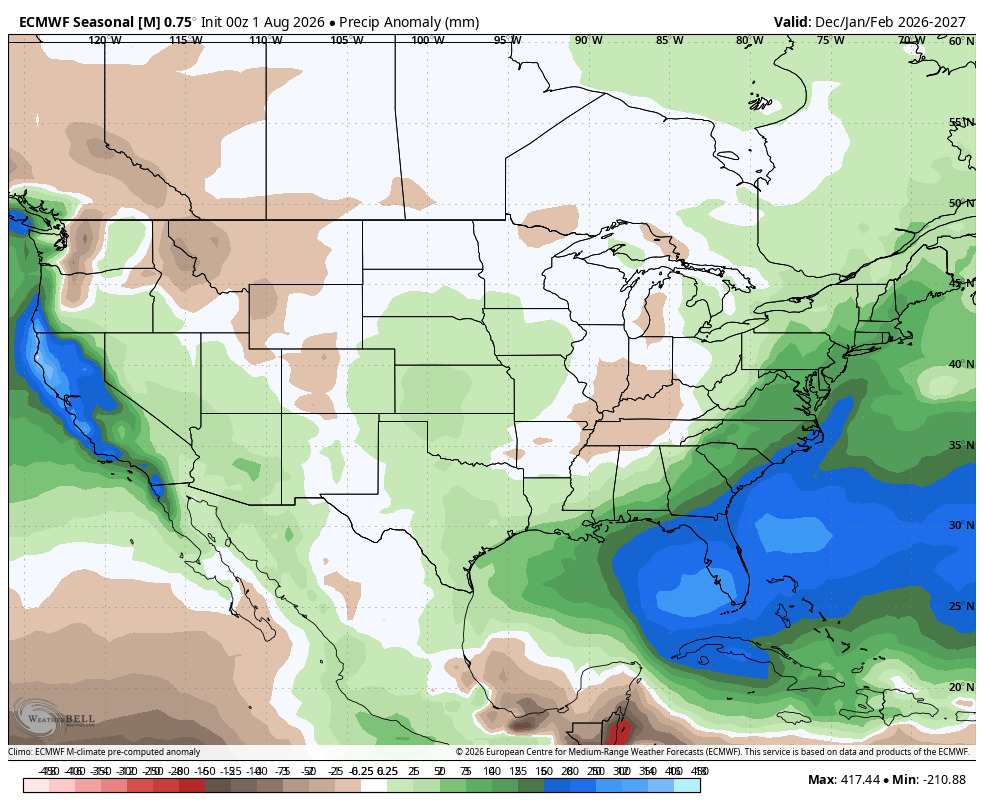
This looks an awful lot like the precipitation composite for the two most east-based El Niños in recorded history, 97-98 and 82-83:
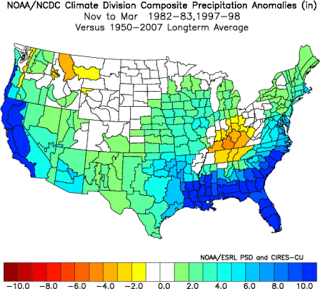
However, it is worth noting that this type of El Niño response typically floods the lower 48 with more mild air, and can thus result in snow-level troubles for mountainous regions. In the Eastern Sierra, we are often high enough to escape most of the snow-level tragedies, but can definitely still see rain to remarkably high elevations.
Beyond that, intraseasonal variability due to factors such as the MJO and Arctic Oscillation (AO) will ultimately still play a substantial role in where the storm track ends up. Because our precipitation often depends on a few higher-end events, whether or not we crack average depends heavily on these subseasonal factors.
The El Niño of 2015-16 resulted in modest precipitation in California, which fell short of what seasonal models were showing. In December, a strongly positive AO was associated with a more poleward jet stream and a much more active PNW, helping steer the most favorable storminess north of California. In February, the MJO spent substantial time in phases 3-4-5, which are all negatively correlated with California precipitation and positively correlated with PNW precipitation. Neither the AO nor MJO alone explains why the winter failed California, but these subseasonal patterns helped push the atmospheric response away from what we would typically hope to see during such a strong El Niño.
Below, you can see the composite map for Atmospheric River frequency in phase 4 of the MJO under a Westerly QBO (the same QBO we had in 15-16 and what we will have this winter).
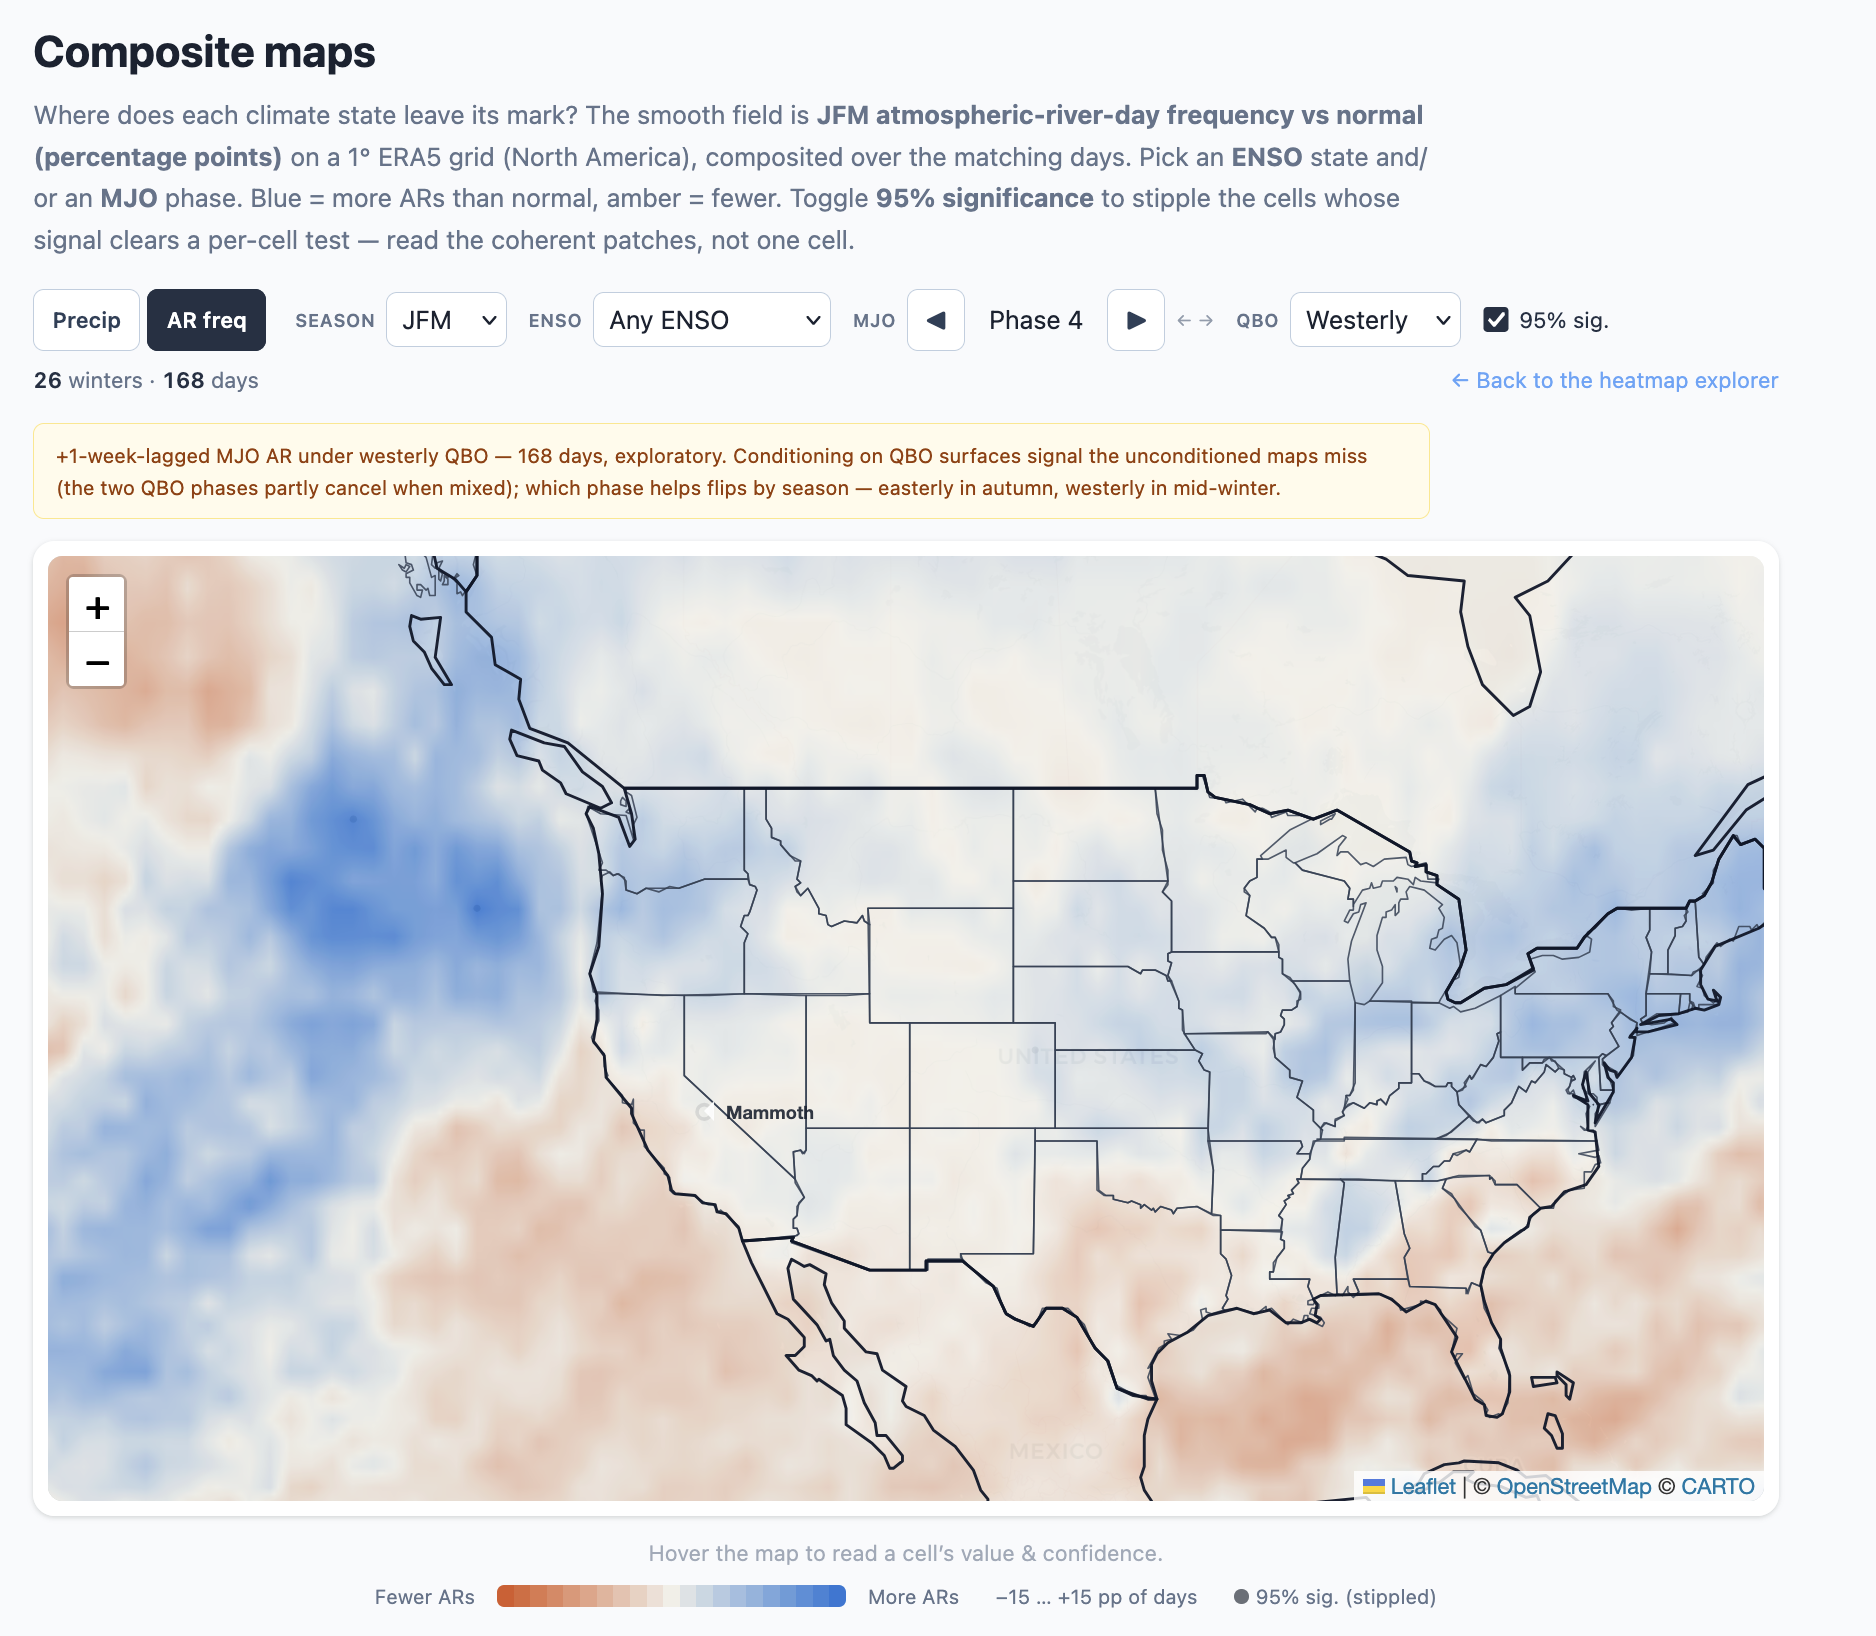
I built these new tools on my site for exploring the interplay between the different teleconnections. Hopefully it will come in handy this winter with subseasonal forecasting! You can view them here:
https://eastsideweather.com/explorer/maps
https://eastsideweather.com/explorer
However, another reason 15-16 failed California is because a lot of the warmest anomalies in the ENSO region were more centrally located. This means that convection did not shift as far eastward, and thus the subtropical jet was not as enhanced into California.
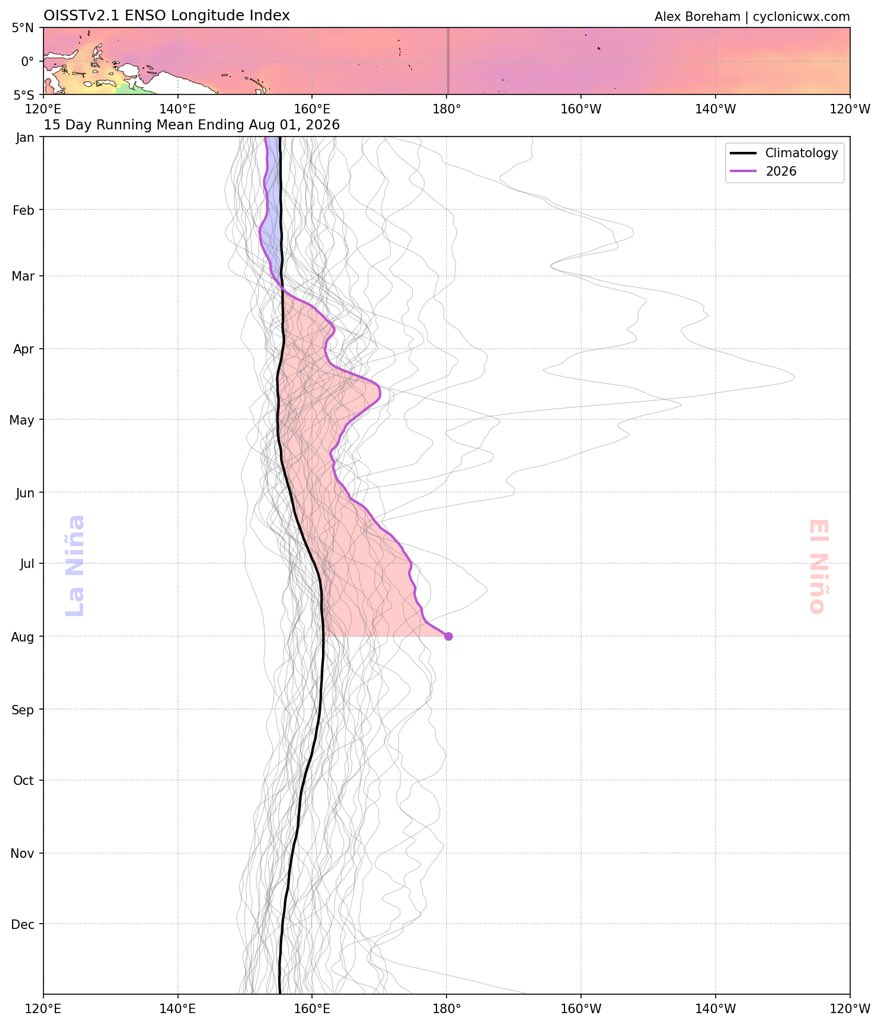
Another way of measuring this is with the ELI (ENSO Longitude Index), which measures how far east or west the warm anomalies sit. Through the start of August, the ELI is running further east than any year on record for this time of year, which should in theory bode well for a canonical response in California this winter. It is still early. The index has months to wander before winter, but this is about as encouraging a starting point as we could ask for. Time will tell!